QUESTION
Question 1: Key Value Drivers
You are analysing Freefly Corp’s growth and market value. You have collected the company’s financial data shown below.
Freefly Corp. Financial Statement
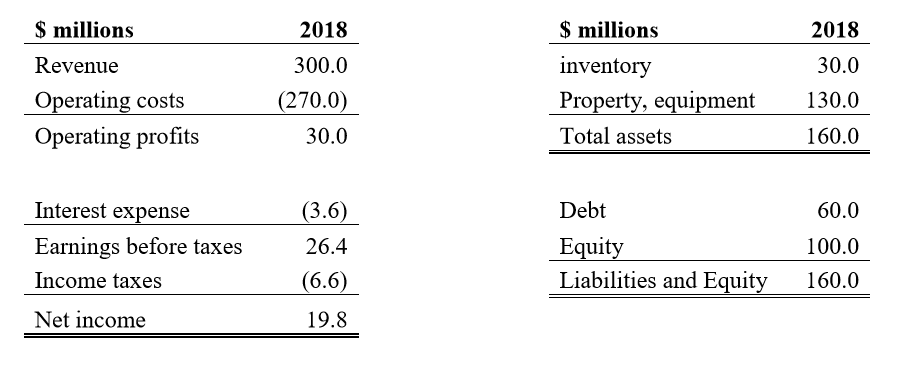
a. What was the company’s ROIC in 2018?
b. If the CFO wants the company to grow at the rate of 7% in profit in 2019, and expects to earn the return on new investment the same rate as the return (ROIC) for Year 2018, what percentage of its after-tax profits should the company reinvest?
c. Use the key value driver equation to value Freefly Corp. Assume that the company has Long-term growth in profit and cash flows of 7%, WACC of 9% and the NOPAT and ROIC remain at current level.
d. If the company grows at 7% in profit and cash flows, will growth create value to the company? Please provide numerical evidence to support your claim.
Question 2: ROIC-Based Valuation
Namo Inc has invested $3 million in capital. It is expected to generate revenue of $280 million next year with stable after-tax operating margin of 15%. Its WACC is 12%. Mira International has invested $5 million in capital. It is expected to generate revenue of $320 million next year with stable after-tax operating margin of 12.5%. Its WACC is 9%. Both companies’ profit and cash flows are growing at a constant rate of 5%.
a. Which company is expected to earn a higher rate of return on invested capital?
b. What are economic profit of Namo Inc and Mira International?
c. Which company has higher enterprise value? Explain your answer. Round up to one decimal.
Question 3: Return on Equity
You are analysing McCall Manufacturing, a provider of security hardware and software products. At the end of last year, the company had $350 million of total assets with 20% total debt and 80% total equity. Its sales for the last year were $400 million with operating profit (EBITA) of 15%. The interest expenses was $20 million and net income was $26 million.
a. What were the company’s profit margin and return on equity last year? Round up to one decimal.
b. Please decompose the return on equity into clean measures of operating performance and financial leverage. What was the company’s rate of return on invested capital last year? Round up to one decimal.
c. If the CFO recommends that the firm borrow money, use it to buy back stock, and raise the debt ratio to 40%. She thinks that there would be no effect on the value of its total assets, sales and the operations of the company, but interest on the new debt would lower the profit margin to 6%. Would this recommendation be a good move (i.e., would it increase the ROE)?
Question 4: Competitive Benchmarking
You have been asked by the CFO of Charles Consulting to evaluate the company’s operating performance and capital efficiency for short-term capital. Operating profits and current assets were as follows:
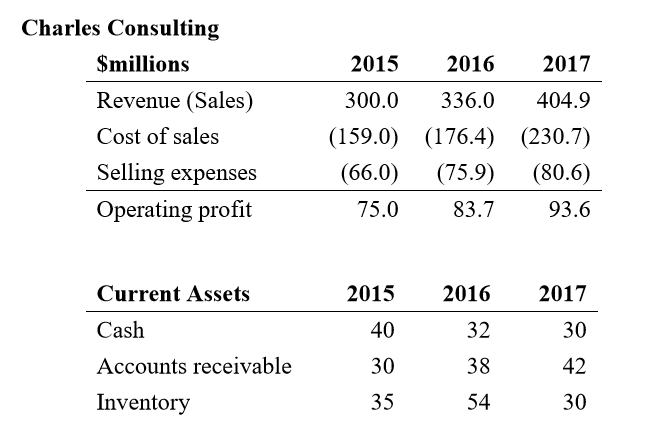
In the footnotes, you notice that in 2017, Charles Consulting changed its policy regarding reimbursed travel. Starting in 2017, consultants no longer submit their expenses directly to the client for direct reimbursement. Instead, Charles Consulting includes the reimbursable travel expenses in revenue, and an equivalent amount of reimbursable expenses is included in costs of sales in the period in which the expense is incurred. The total travel expenses in 2015, 2016 and 2017 were $35, $38 and $42, respectively.
a. Please make adjustments for travel reimbursements to measure like-for-like performance. Has the growth in revenue been increasing over time? Has operating performance been improving or declining over time?
b. What was the collection period for Charles Consulting in 2017?
c. Using the appropriate ratios, has Charles Consulting been managing its account receivables efficiently?
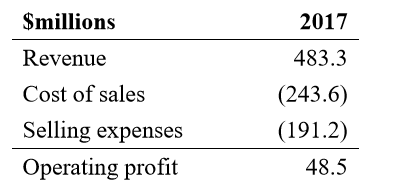
d. You have collected data of Macro Consulting for comparison. The data in 2017 are shown below. Using the appropriate like-for-like comparison, between Charles Consulting and Macro Consulting, which company better managed its operating performance in 2017?
Question 5: Project Selection
Image Corp.’s capital structure consists of a constant 50% net debt-to-enterprise value and 50% equity-to-enterprise value.
The company is currently considering three projects: A, B and C. The free cash flows of Project A are estimated as follows:
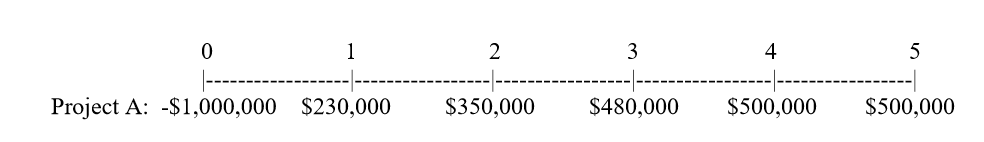
Project A’s equity beta is 1.2 and its before-tax cost of debt is 6%. The corporate tax rate is 35%. The current risk-free-rate is 3%, and the market risk premium is 5%.
a. Assuming that the CAPM holds, what is the cost of equity for Project A?
b. What is Project A’s WACC?
c. What is the net present value (NPV) of Project A?
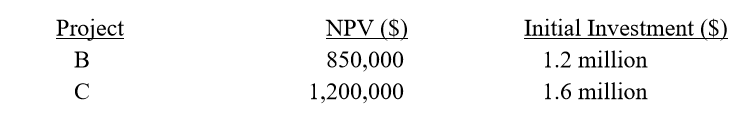
d. Besides Project A, the company is considering another two projects: Project B and C. The NPVs and initial investments of the two projects are below. The company has $3 million budget. Which of the three projects should the company undertake?
ANSWER
1 a-
Answer-
Net Operating Profit after tax= $ 19.8 Million
Invested Capital= $ 160 Million
ROIC= 19.8/160= 12.375%
b
Answer- Estimated Profit in 2019= $ 19.8 x 1.07= 21.186
Required ROIC= 12.375%
Capital required= 21.186/12.375% = $ 171.2 Million
Profit to be reinvested= 171.2-160= $ 11.2 Million
C.
Answer- Net Income= $19.8 Million
Growth= 7%
WACC= 9%
Value= $19.8/ (9%-7%) = $ 990 Million
d.
Answer- Net Income= $19.8 million
Growth= 0% assumed
WACC= 9%
Value= 19.8/0.09= $ 220.
Value with growth= $990
Value created by growth= $770 Million
2 a
Answer-
-
Amount in $ Million
Namo
Mira
1
Invested Capital
3
5
2
Revenue
280
320
3
Operating Margin
15%
12.50%
4=2X3
After Tax Operating profit
42
40
4/1
ROIC
1400%
800%
Namo Limited is expected to generate a higher rate of return on invested capital.
Answer-
-
Amount in $ Million
Namo
Mira
1
Invested Capital
3
5
2
WACC
12%
9%
3=1×2
Economic Profit
0.36
0.45
Answer
|
|
Amount in $ Million |
Namo |
Mira |
|
1 |
Invested Capital |
3 |
5 |
|
2 |
Revenue |
280 |
320 |
|
3 |
Operating Margin |
15% |
12.50% |
|
4=2X3 |
After Tax Operating profit |
42 |
40 |
|
5 |
WACC |
12% |
9% |
|
6 |
Growth |
5% |
5% |
|
7=4/(5-6) |
Enterprise Value |
600 |
1000 |
3 a
Answer:
-
Amount in $ Million
1
Sales
400
Operating profit
60
Less: Interest
20
Profit Before Taxes
40
Tax
14
2
Net Income
26
3=2/1
Profit Margin
6.5%
4=350*80%
Equity
280
3/4
Return on Equity
9.3%
Answer- Operating Margin= Operating Profit/ Net sales =60/400= 15%
Financial Leverage= Total debt/ total Asset= 20%
% age interest to Sales= 5%
ROIC= Net operating profit after tax/ Net invested capital = (26+20)/350 = 13.2%
Answer:
-
Profit Margin
6%
Net Profit For Equity Shareholder (6% x 400)
24
Equity Capital (350x 60%)
210
ROE
11.4%
It will be a good move and it will increase the ROE by 2.1%.
4 a
Answer:
-
Sales in Million( $)
2015
2016
2017
Revenue
300
336
404.9
Adjustment for traveling expense
-42
Adjusted Revenue
300
336
362.9
Growth in Revenue
12.00%
8.01%
Cost of sales
159
176.4
230.7
Adjustment for traveling expense
-42
Adjusted cost of sales
159
176.4
188.7
Selling expense
66
75.9
80.6
Operating Profit
75
83.7
93.6
% increase in Operating Profit
11.6%
11.8%
Operating profit ratio
25.0%
24.9%
23.1%
Sales Growth Rate has declined from 2016 to 2017, Operating profit ratio has also been declining since 2015.
Answer:
-
Sales in Million( $)
2015
2016
2017
Revenue
300
336
404.9
Adjustment for traveling expense
-42
Adjusted Revenue
300
336
362.9
Accounts Receivable
30
38
42
Accounts Receivable Turnover ratio= Sales/ Average accounts receivable
9.9
9.1
Collection Period= 365/AR Turnover ratio
37
40
Collection Period in 2017 is 40 Days
Answer- The collection period has increased from 37 to 40 from 2016 to 2017, and Turnover ratio has declined from 9.9 to 9.1 from 2016 to 2017. Hence it can be said that Charles consulting is not managing it accounts receivables efficiently.
d.
Answer
-
Charles Consulting
Macro Consulting
Sales in Million( $)
2017
2017
Revenue
404.9
Adjustment for traveling expense
-42
Adjusted Revenue
362.9
483.3
Cost of sales
230.7
Adjustment for traveling expense
-42
Adjusted cost of sales
188.7
243.6
Gross Profit
174.2
239.7
Gross Profit ratio
48.0%
49.6%
Selling expense
80.6
191.2
Operating Profit
93.6
48.5
Operating profit ratio
23.10%
10.04%
From the above it can be seen that Charles consulting is operating more efficiently than Macro consulting, considering operating profits. However gross profit and gross profit ratio of Macro consulting is higher than Charles Consultancy, since operating profit is the ultimate outcome, it can be said that Charles consultancy is having an upper hand in operating performance.
5.
Answer- Cost of equity as per CAPM= Rf + (Rm-Rf) x Beta = 3% + 5% X 1.2 = 9%
Answer- After tax cost of debt = before-tax cost of debt x (1- Tax rate) = 6% x (1-35%) = 3.9%
WACC= weight of debt X cost of debt + weight of equity x cost of equity = 50% X 3.9% + 50% X 9%= 6.45%
-
Year
Cash Flow
PV Factor @ 6.45%
Present Value
0
-1000000
1.00
-1000000
1
230000
0.94
216064
2
350000
0.88
308871
3
480000
0.83
397928
4
500000
0.78
389392
5
500000
0.73
365798
NPV
$ 678053
d.
Answer- The problem can be solved by using Profitability index, which is given by NPV/ Initial Investment.
Since the PI of project B and C is high, the company shall invest in project B and C.
|
Project |
NPV |
Initial Investment |
PI |
|
A |
678053 |
1000000 |
1.68 |
|
B |
850000 |
1200000 |
1.71 |
|
C |
1200000 |
1600000 |
1.75 |
Looking for Finance Assignment Help. Whatsapp us at +16469488918 or chat with our chat representative showing on lower right corner or order from here. You can also take help from our Live Assignment helper for any exam or live assignment related assistance