QUESTION
AQR Momentum Funds (A)
Course: Portfolio Management
Guideline Questions
You are an investment consultant and your are doing an analysis of AQR’s momentum funds to determine whether you should advise your clients for or against investing in the momentum funds. Addressing the following questions may be helpful. Your clients are well off but not wealthy enough to invest in hedge funds
1. Should AQR launch its momentum fund
2. Do you believe the FF momentum factor (UMD/MOM) will have returns over the next decade that are significantly greater than zero, significantly less than zero or approximately zero?
3. Compare the UMD factor to other specifications for momentum (e.g. Dec10 — Dec1, or [(Dec10+Dec9)-(Dec1+Dec2)], or . . . ). Does this affect your beliefs in 2 above?
4. What are the appropriate benchmarks for AQR’s momentum funds? Would you expect the net performance of the funds to exceed these benchmarks? Why or why not?
5. The advantageous correlation structure in Exhibit 5 is seen as a key advantage of the fund. Is this the right way to think about the risk of the funds? If not use the data to construct more informative risk characteristics of the funds. Does this affect AQR’s story?
6. Does momentum make and attractive product for retail mutual fund investors?
7. How should AQR mange its momentum funds in its objective to maximize returns while minimize its tracking error.
8. Which potential clients should AQR target with the fund?
You should outline exactly in the appendix the implementation strategy for a Momentum fund that satisfies question 7 (I want a step by step recipe on how to implement the strategy!) Additional Material:
• Spreadsheet with asset class returns:
AQRMomStrategies.
Copy Right
| Name of Case: AQR’s Momentum Funds (A) | ||||||||
| Harvard Business School Case 211-025 | ||||||||
| Courseware 9-213-722 | ||||||||
| This courseware was prepared solely as the basis for class discussion. Cases are not intended to serve as endorsements, sources of primary data, or illustrations of effective or ineffective management. Copyright © 2009 President and Fellows of Harvard College. No part of this product may be reproduced, stored in a retrieval system, used in a spreadsheet or transmitted in any form or by any means—electronic, mechanical, photocopying, recording or otherwise—without the permission of Harvard Business School. | ||||||||
MOM Returns 1927-2008
| Exhibit 4 Annual Value-Weight Returns to Portfolios Formed on Past Returns (1927-2008) | |||||||||||
| Average Annual Value-Weight Returns to Portfolios Formed on Past Returns (t-12 to t-2) | |||||||||||
| Year | Low | 2 | 3 | 4 | 5 | 6 | 7 | 8 | 9 | High | High-Low |
| 1927 | 18.48 | 9.07 | 17.17 | 26.26 | 32.73 | 25.11 | 35.4 | 27.19 | 39.44 | 67.43 | 48.95 |
| 1928 | 14.72 | 23.2 | 21.38 | 26.09 | 25.53 | 34.27 | 41.87 | 42.82 | 48.69 | 89.33 | 74.61 |
| 1929 | -57.59 | -47.84 | -34.22 | -21.34 | -2.32 | -13.33 | 5.95 | 1.32 | 0.25 | -29.87 | 27.72 |
| 1930 | -54.58 | -48.38 | -50.44 | -49.55 | -31.69 | -31.66 | -32.42 | -19.73 | -22.9 | -20.87 | 33.71 |
| 1931 | -64.51 | -58.34 | -60.56 | -52.91 | -53.87 | -49.74 | -49.39 | -42.47 | -34.78 | -24.23 | 40.28 |
| 1932 | 25.69 | -2.46 | -12.21 | -7.47 | 9.31 | -1.33 | -17.06 | -14.37 | -12.36 | -25.79 | -51.48 |
| 1933 | 64.45 | 67.3 | 53.29 | 94.86 | 48.35 | 68.61 | 55.22 | 83.8 | 82.27 | 52.31 | -12.14 |
| 1934 | -6.67 | -2.42 | -9.87 | 0.16 | -11.03 | 3.73 | 8.62 | -1.35 | 6.42 | 15.33 | 22 |
| 1935 | 24.05 | 84.96 | 30.9 | 37.39 | 44.59 | 35.53 | 46.87 | 48.38 | 55.08 | 75 | 50.95 |
| 1936 | 32.37 | 22.85 | 24.37 | 28.69 | 38.51 | 29.36 | 36.34 | 24.37 | 50.56 | 46.8 | 14.43 |
| 1937 | -46.25 | -30.35 | -33.03 | -37.85 | -37.11 | -35.54 | -32.29 | -28.54 | -41.9 | -46.34 | -0.09 |
| 1938 | 30.89 | 27.17 | 30.16 | 27.67 | 24.98 | 28.73 | 50.18 | 25.96 | 16.95 | 24.61 | -6.28 |
| 1939 | -10.67 | 12.4 | 0.41 | 0.26 | 3.92 | 1.41 | 6.43 | 5.85 | -2.36 | -0.25 | 10.42 |
| 1940 | -16.25 | -11.04 | -4.35 | 2.03 | -6.16 | -5.8 | -7.87 | -11.14 | -9.91 | -3.24 | 13.01 |
| 1941 | -28.06 | -14.71 | -15.22 | -6.62 | -13.03 | -12.03 | -3.87 | -3.31 | -2.23 | -7.34 | 20.72 |
| 1942 | 37.75 | 33.73 | 23.1 | 19.98 | 7.8 | 15.74 | 13.95 | 4.61 | 14.46 | 17.96 | -19.79 |
| 1943 | 37.74 | 21.12 | 26.3 | 30.32 | 31.18 | 25.3 | 33.13 | 36.05 | 40.99 | 51.35 | 13.61 |
| 1944 | 21.85 | 20.54 | 18.65 | 26.08 | 18.3 | 25.55 | 26.58 | 35.49 | 36.47 | 33.5 | 11.65 |
| 1945 | 42.26 | 32.69 | 27.11 | 39.62 | 31.32 | 51.93 | 41.69 | 52.17 | 60.74 | 74.67 | 32.41 |
| 1946 | -16.25 | -13.18 | -0.18 | -7.8 | 4 | -3.49 | -0.55 | -5.63 | -9.42 | -3.06 | 13.19 |
| 1947 | -13.12 | -7.46 | 0.07 | 2.98 | 4.91 | 5.98 | 13.74 | 7.98 | -0.49 | 4.18 | 17.3 |
| 1948 | -14.25 | -0.88 | -5.12 | 9.21 | 1.22 | -0.78 | -2.29 | 6.53 | 5.08 | 8.52 | 22.77 |
| 1949 | 30.51 | 22 | 22.85 | 19.1 | 19.61 | 14.98 | 23.04 | 22.33 | 15.82 | 27.04 | -3.47 |
| 1950 | 17.08 | 27.21 | 19.56 | 30.14 | 32.78 | 27.73 | 26.37 | 38.86 | 43.53 | 34.97 | 17.89 |
| 1951 | 13.04 | 13.74 | 15.49 | 13.74 | 21.2 | 16.13 | 24.49 | 28.03 | 30.65 | 20.7 | 7.66 |
| 1952 | 3.13 | 9.01 | 8.42 | 6.06 | 11.1 | 17.59 | 14.13 | 18.88 | 12.66 | 18.39 | 15.26 |
| 1953 | -19.72 | -5.53 | -5.89 | -5.95 | 1.85 | 3.34 | 3.52 | 3.8 | 10.07 | -0.65 | 19.07 |
| 1954 | 48.69 | 40.04 | 40.86 | 43.6 | 34.48 | 56.33 | 48.36 | 54.43 | 48.53 | 65.31 | 16.62 |
| 1955 | 14.52 | 15.24 | 15.84 | 18.28 | 25.02 | 22.73 | 38.93 | 23.79 | 30.86 | 39.07 | 24.55 |
| 1956 | -6.44 | -0.95 | 3 | 6.54 | 8.26 | 9.04 | 10.31 | 10.66 | 12.14 | 12.45 | 18.89 |
| 1957 | -25.75 | -21.47 | -13.1 | -10.35 | -6.12 | -10.63 | -6.49 | -9 | -15.05 | -1.88 | 23.87 |
| 1958 | 71.75 | 55.46 | 50.19 | 41.24 | 51.6 | 48.4 | 37.88 | 36.06 | 43.07 | 53.01 | -18.74 |
| 1959 | -1.98 | -2.07 | 12.16 | 18.74 | 13.53 | 11.83 | 15.24 | 25.3 | 16.52 | 35.19 | 37.17 |
| 1960 | -12.9 | -10.22 | -3.73 | -10.07 | 1.67 | -1.26 | -2.47 | 1.49 | 13.36 | 17.67 | 30.57 |
| 1961 | 33.93 | 17.99 | 18.35 | 19.86 | 34.29 | 31.99 | 31.51 | 21.02 | 31.02 | 30.33 | -3.6 |
| 1962 | -20.06 | -21.89 | -20.3 | -13.73 | -9.51 | -5.21 | -12.49 | -7.11 | -4.87 | -9.59 | 10.47 |
| 1963 | 6.73 | 15.69 | 16.15 | 24.7 | 14.05 | 18.04 | 19.33 | 16.98 | 28.01 | 28.93 | 22.2 |
| 1964 | 8.72 | 17.57 | 16.81 | 13.84 | 15.47 | 14.65 | 13.13 | 23.96 | 10.22 | 20.64 | 11.92 |
| 1965 | 22.26 | 10.37 | 9.53 | 13.53 | 9.39 | 6.76 | 8.64 | 23.71 | 25.36 | 51.56 | 29.3 |
| 1966 | -14.33 | -11.86 | -12.75 | -14.03 | -8.26 | -1.78 | -6.98 | -6.82 | -0.99 | 5.4 | 19.73 |
| 1967 | 36.66 | 32.25 | 24.69 | 23.93 | 13.02 | 23.97 | 23.17 | 36.3 | 38.86 | 66.1 | 29.44 |
| 1968 | 20.1 | 19.89 | 11.75 | 3.97 | 24.89 | 8.6 | 1.86 | 11.83 | 23.05 | 33.62 | 13.52 |
| 1969 | -35.72 | -17.35 | -9.57 | -15.83 | -14.63 | -13.59 | -10.29 | -12.82 | -10.67 | -5.71 | 30.01 |
| 1970 | -20.67 | -2.38 | 11.98 | 9.31 | 11.6 | 4.39 | 2.82 | 3.58 | -5.18 | -8.41 | 12.26 |
| 1971 | 11.75 | 15.98 | 33.82 | 14.84 | 10.38 | 23.85 | 19.1 | 9.69 | 14.21 | 28.19 | 16.44 |
| 1972 | -3.88 | 6.19 | 6.23 | 7.29 | 20.02 | 20.31 | 18.32 | 12.26 | 25.85 | 30.5 | 34.38 |
| 1973 | -52.92 | -48.51 | -38.47 | -31.43 | -22.07 | -18.93 | -12.83 | -17.63 | -14.24 | -2.72 | 50.2 |
| 1974 | -39.23 | -30.15 | -26.39 | -18.18 | -28.87 | -29.56 | -26.98 | -18.7 | -21.69 | -30.38 | 8.85 |
| 1975 | 55.62 | 51.87 | 50.19 | 43.34 | 37.34 | 42.45 | 24.5 | 26.39 | 34.24 | 41.03 | -14.59 |
| 1976 | 18.09 | 18.98 | 18.33 | 33.63 | 37.85 | 26.77 | 34.76 | 27.02 | 26.57 | 33.57 | 15.48 |
| 1977 | -17.86 | -11.49 | -7.22 | -2.66 | -3.09 | -0.2 | 1.06 | 8.12 | 9.44 | 15.51 | 33.37 |
| 1978 | -0.17 | 6.65 | 7.53 | 6.91 | -2.56 | 9.59 | 4.3 | 13.33 | 23.53 | 30.4 | 30.57 |
| 1979 | 17.1 | 14.89 | 17.37 | 12.29 | 16.4 | 22.52 | 19.2 | 37.4 | 41.14 | 57.69 | 40.59 |
| 1980 | 29.65 | 15.01 | 20.05 | 15.42 | 8.51 | 32.71 | 35.57 | 50.13 | 56.84 | 53.8 | 24.15 |
| 1981 | -0.66 | 11.74 | 4.53 | 8.33 | 1.74 | -7.9 | -6.2 | -11.14 | -6.91 | -13.98 | -13.32 |
| 1982 | -11.17 | 3.78 | 18.79 | 17.52 | 9.54 | 27.12 | 30.58 | 31.67 | 41.35 | 35.3 | 46.47 |
| 1983 | 34.37 | 37.37 | 23.46 | 24.75 | 20.63 | 13.55 | 22.53 | 14.22 | 18.4 | 16.37 | -18 |
| 1984 | -20.28 | -1.06 | 6.92 | 3.47 | 9.83 | 9.87 | 6.71 | 3.84 | 2.74 | -3.74 | 16.54 |
| 1985 | 10.64 | 26.56 | 31.48 | 39.53 | 31.34 | 40.5 | 31.26 | 33.7 | 31.61 | 36.3 | 25.66 |
| 1986 | -1.54 | 10.74 | 22.69 | 16.15 | 18.66 | 13.24 | 18.09 | 20.06 | 20.47 | 18.77 | 20.31 |
| 1987 | -8.36 | 14.9 | 11.36 | 2.43 | -4.39 | -3.15 | -4.52 | 2.88 | -2.26 | 10.52 | 18.88 |
| 1988 | 17.82 | 30.94 | 31.37 | 25.04 | 18.46 | 11.74 | 18.23 | 11.24 | 19.98 | 12.54 | -5.28 |
| 1989 | -9.26 | 7.7 | 14.02 | 22.96 | 28.96 | 25.3 | 31.83 | 36.59 | 42.8 | 40.93 | 50.19 |
| 1990 | -41.67 | -23.42 | -15.47 | -13.27 | -8.84 | -3.71 | -1.45 | -2 | -0.64 | -6.77 | 34.9 |
| 1991 | 26.09 | 46.53 | 45.46 | 27.14 | 29.61 | 31.28 | 31.55 | 38.61 | 35.01 | 60.2 | 34.11 |
| 1992 | 7.65 | 13.76 | 7.26 | 14.8 | 11.15 | 9.7 | 5.37 | 7.12 | 4.45 | 18.79 | 11.14 |
| 1993 | 1 | 3.73 | -1.74 | 0.56 | 4.51 | 10.62 | 10.53 | 23.37 | 20.36 | 35.27 | 34.27 |
| 1994 | -3.6 | 2.1 | -0.33 | -1.8 | -2.41 | 2.75 | 0.94 | -0.8 | -3.14 | -0.22 | 3.38 |
| 1995 | 17.82 | 23.65 | 33.41 | 38.38 | 31.39 | 36.11 | 38.55 | 37.86 | 38.65 | 35.48 | 17.66 |
| 1996 | 14.51 | 14.34 | 19.91 | 28.03 | 16.97 | 18.58 | 23.38 | 28.22 | 19.11 | 18.16 | 3.65 |
| 1997 | 5.08 | 26.13 | 39.34 | 27.53 | 25.76 | 32.74 | 33.71 | 39.28 | 23.85 | 32.94 | 27.86 |
| 1998 | 0.46 | -0.49 | 19.58 | 15.37 | 10.68 | 14.59 | 23.81 | 27.35 | 28.25 | 54.69 | 54.23 |
| 1999 | 12.86 | 14.18 | 1.61 | -3.22 | 5.31 | 1.51 | 1.01 | 19.91 | 13.27 | 62.11 | 49.25 |
| 2000 | -47.53 | 6.35 | -8.17 | 22.24 | 2.25 | 5.52 | -10.95 | 1.39 | -8.22 | -21.85 | 25.68 |
| 2001 | -17.03 | -9.34 | -15.39 | -1 | 0.2 | -13.52 | -1.39 | -3.64 | -11.18 | -7.93 | 9.1 |
| 2002 | -37.28 | -37 | -24.06 | -23.38 | -18.03 | -19.83 | -4.03 | -13.76 | -5.85 | -11.53 | 25.75 |
| 2003 | 79.61 | 64.57 | 42.41 | 43.58 | 22.79 | 24.92 | 18.87 | 20.95 | 31.86 | 41.88 | -37.73 |
| 2004 | 23.03 | 6.86 | 12.27 | 17.23 | 7.02 | 10.55 | 13.39 | 9.83 | 17.39 | 8.88 | -14.15 |
| 2005 | 2.08 | 4.53 | -1.29 | 2.1 | 5.97 | 7.01 | 5.97 | 17.62 | 11.91 | 19.34 | 17.26 |
| 2006 | 22.42 | 19.48 | 21.57 | 14.99 | 21.31 | 12.07 | 12.76 | 12.08 | 12.12 | 3.92 | -18.5 |
| 2007 | -18.83 | -8.78 | -5.63 | -2.81 | 2.72 | 6.91 | 7.7 | 19.92 | 9.25 | 24.79 | 43.62 |
| 2008 | -69.21 | -53.8 | -44.61 | -34.96 | -29.89 | -33.28 | -26.78 | -6.36 | -39.68 | -38.84 | 30.37 |
| Average | 2.42 | 7.51 | 7.95 | 10.22 | 10.05 | 11.17 | 12.47 | 14.75 | 15.6 | 20.42 | 17.99 |
Portfolio Strategies 1927-2008
| Annual Returns on Market, HML, SMB, UMD, and each component portfolio (1927-2008) | |||||||||||||
| Market Risk Premium | Based on Book Value-to-Market Value | Based on Market Capitalization | Based on past year performance (t-12 to t-12) | ||||||||||
| High (Value) | Low (Growth) | High-Low | Small | Big | Small-Big | Up | Down | Up-Down | |||||
| Year | Mkt-RF | H | L | HML | S | B | SMB | U | D | UMD | |||
| 1927 | 30.29 | 35.10 | 38.73 | -3.63 | 31.38 | 34.37 | -2.99 | 38.27 | 15.39 | 22.88 | |||
| 1928 | 35.51 | 33.69 | 38.83 | -5.15 | 37.93 | 34.51 | 3.43 | 50.31 | 22.81 | 27.51 | |||
| 1929 | -19.76 | -20.61 | -32.53 | 11.92 | -37.64 | -7.85 | -29.79 | -21.15 | -42.41 | 21.27 | |||
| 1930 | -31.24 | -44.35 | -30.85 | -13.50 | -37.56 | -33.06 | -4.50 | -23.19 | -49.61 | 26.42 | |||
| 1931 | -45.44 | -54.79 | -38.86 | -15.93 | -47.24 | -51.47 | 4.23 | -35.33 | -59.61 | 24.28 | |||
| 1932 | -9.43 | -0.77 | -6.31 | 5.54 | -3.82 | -9.45 | 5.63 | -14.08 | 5.44 | -19.52 | |||
| 1933 | 57.20 | 120.35 | 105.20 | 15.15 | 136.94 | 82.88 | 54.07 | 109.53 | 90.01 | 19.53 | |||
| 1934 | 4.09 | -6.91 | 22.45 | -29.36 | 20.65 | -4.66 | 25.31 | 21.12 | 2.97 | 18.15 | |||
| 1935 | 44.70 | 52.35 | 39.12 | 13.23 | 55.35 | 46.70 | 8.64 | 68.88 | 47.71 | 21.18 | |||
| 1936 | 31.97 | 61.43 | 32.23 | 29.21 | 53.67 | 37.51 | 16.16 | 45.90 | 39.45 | 6.46 | |||
| 1937 | -34.90 | -45.56 | -41.53 | -4.04 | -49.17 | -35.70 | -13.47 | -44.23 | -41.61 | -2.62 | |||
| 1938 | 28.20 | 25.81 | 40.08 | -14.27 | 38.98 | 26.42 | 12.57 | 31.53 | 30.98 | 0.55 | |||
| 1939 | 2.11 | -8.57 | 8.81 | -17.38 | 2.44 | -3.03 | 5.47 | 3.15 | 2.50 | 0.65 | |||
| 1940 | -7.43 | -6.47 | -5.52 | -0.95 | -4.52 | -5.32 | 0.80 | -3.67 | -9.47 | 5.80 | |||
| 1941 | -9.67 | -2.92 | -14.59 | 11.68 | -10.69 | -6.36 | -4.33 | -4.01 | -13.28 | 9.28 | |||
| 1942 | 16.02 | 34.32 | 15.24 | 19.08 | 26.75 | 21.45 | 5.30 | 16.94 | 31.98 | -15.05 | |||
| 1943 | 27.70 | 68.48 | 33.94 | 34.54 | 64.64 | 33.34 | 31.30 | 55.63 | 41.89 | 13.74 | |||
| 1944 | 21.02 | 46.40 | 28.22 | 18.18 | 43.63 | 26.77 | 16.86 | 41.21 | 31.01 | 10.21 | |||
| 1945 | 38.13 | 61.34 | 47.52 | 13.82 | 65.40 | 40.09 | 25.31 | 64.31 | 50.07 | 14.24 | |||
| 1946 | -6.26 | -7.78 | -9.82 | 2.04 | -9.88 | -5.70 | -4.18 | -7.63 | -12.53 | 4.91 | |||
| 1947 | 2.88 | 6.98 | -2.51 | 9.48 | -1.97 | 5.62 | -7.59 | 6.93 | -7.40 | 14.32 | |||
| 1948 | 1.52 | 1.03 | -1.97 | 3.00 | -5.81 | 3.35 | -9.16 | 4.16 | -8.19 | 12.34 | |||
| 1949 | 18.99 | 19.82 | 23.61 | -3.79 | 22.67 | 19.15 | 3.51 | 23.33 | 22.88 | 0.45 | |||
| 1950 | 28.81 | 54.10 | 26.85 | 27.25 | 38.09 | 36.92 | 1.17 | 43.63 | 28.07 | 15.57 | |||
| 1951 | 19.34 | 12.84 | 18.41 | -5.58 | 14.78 | 19.53 | -4.75 | 24.04 | 12.56 | 11.48 | |||
| 1952 | 11.64 | 14.74 | 10.11 | 4.64 | 8.74 | 15.56 | -6.82 | 15.03 | 6.01 | 9.02 | |||
| 1953 | -1.47 | -7.18 | 1.36 | -8.53 | -2.29 | -1.74 | -0.55 | 5.49 | -10.85 | 16.33 | |||
| 1954 | 49.31 | 70.50 | 45.35 | 25.15 | 55.74 | 57.92 | -2.18 | 59.49 | 48.98 | 10.52 | |||
| 1955 | 23.73 | 26.68 | 21.67 | 5.02 | 19.72 | 25.68 | -5.96 | 29.31 | 15.36 | 13.96 | |||
| 1956 | 6.01 | 5.64 | 7.27 | -1.63 | 7.53 | 8.00 | -0.48 | 16.84 | -2.46 | 19.30 | |||
| 1957 | -13.53 | -19.63 | -12.91 | -6.72 | -16.03 | -13.42 | -2.60 | -11.29 | -21.12 | 9.84 | |||
| 1958 | 43.30 | 71.86 | 58.90 | 12.96 | 68.18 | 53.48 | 14.70 | 52.53 | 62.41 | -9.89 | |||
| 1959 | 9.62 | 18.28 | 16.79 | 1.49 | 19.48 | 13.91 | 5.57 | 24.39 | 5.21 | 19.18 | |||
| 1960 | -1.52 | -7.37 | -2.10 | -5.27 | -3.12 | -0.90 | -2.22 | 7.40 | -10.08 | 17.48 | |||
| 1961 | 24.82 | 30.25 | 23.93 | 6.32 | 27.71 | 27.42 | 0.29 | 33.19 | 22.78 | 10.41 | |||
| 1962 | -13.05 | -6.23 | -15.55 | 9.32 | -15.14 | -6.61 | -8.52 | -9.32 | -21.26 | 11.95 | |||
| 1963 | 17.77 | 31.16 | 14.77 | 16.39 | 17.91 | 23.93 | -6.02 | 25.09 | 13.47 | 11.63 | |||
| 1964 | 12.78 | 21.65 | 11.25 | 10.40 | 16.64 | 18.04 | -1.40 | 19.10 | 14.38 | 4.72 | |||
| 1965 | 10.47 | 32.40 | 24.74 | 7.66 | 36.84 | 15.22 | 21.62 | 38.72 | 18.28 | 20.44 | |||
| 1966 | -13.44 | -8.93 | -8.09 | -0.84 | -6.17 | -9.02 | 2.85 | -1.89 | -12.21 | 10.33 | |||
| 1967 | 24.36 | 50.19 | 58.67 | -8.48 | 76.15 | 25.67 | 50.48 | 68.12 | 45.64 | 22.49 | |||
| 1968 | 8.95 | 36.73 | 18.13 | 18.60 | 39.83 | 15.63 | 24.20 | 28.48 | 25.86 | 2.62 | |||
| 1969 | -17.41 | -20.89 | -11.07 | -9.82 | -24.31 | -10.19 | -14.12 | -13.72 | -23.63 | 9.91 | |||
| 1970 | -6.44 | 8.57 | -13.49 | 22.06 | -7.61 | 4.28 | -11.90 | -8.03 | -4.82 | -3.21 | |||
| 1971 | 11.81 | 14.21 | 25.23 | -11.03 | 20.60 | 14.66 | 5.93 | 21.74 | 18.04 | 3.70 | |||
| 1972 | 13.50 | 12.74 | 11.03 | 1.72 | 5.24 | 16.94 | -11.70 | 16.97 | 1.71 | 15.26 | |||
| 1973 | -25.68 | -15.68 | -33.59 | 17.91 | -35.01 | -11.62 | -23.39 | -16.39 | -45.74 | 29.36 | |||
| 1974 | -35.95 | -20.76 | -30.91 | 10.15 | -25.80 | -25.03 | -0.77 | -23.39 | -31.44 | 8.05 | |||
| 1975 | 31.56 | 56.83 | 47.84 | 8.99 | 59.25 | 43.84 | 15.40 | 40.15 | 58.89 | -18.74 | |||
| 1976 | 21.68 | 52.73 | 28.01 | 24.72 | 48.86 | 34.26 | 14.60 | 37.78 | 30.37 | 7.41 | |||
| 1977 | -8.10 | 12.32 | 4.57 | 7.75 | 20.19 | -2.99 | 23.19 | 15.35 | -2.84 | 18.19 | |||
| 1978 | 1.36 | 12.95 | 12.31 | 0.65 | 20.40 | 5.89 | 14.51 | 22.01 | 10.08 | 11.93 | |||
| 1979 | 14.03 | 31.27 | 33.02 | -1.75 | 42.30 | 20.95 | 21.35 | 48.33 | 21.88 | 26.45 | |||
| 1980 | 21.98 | 19.15 | 44.34 | -25.19 | 35.34 | 29.55 | 5.79 | 57.58 | 20.45 | 37.13 | |||
| 1981 | -18.70 | 15.87 | -9.30 | 25.17 | 6.88 | -0.36 | 7.24 | -5.29 | 2.83 | -8.12 | |||
| 1982 | 9.89 | 34.31 | 20.50 | 13.82 | 31.49 | 22.22 | 9.27 | 39.83 | 5.32 | 34.51 | |||
| 1983 | 13.85 | 37.69 | 17.14 | 20.55 | 36.14 | 22.36 | 13.78 | 21.72 | 31.69 | -9.97 | |||
| 1984 | -6.68 | 12.08 | -7.29 | 19.36 | -1.07 | 7.00 | -8.07 | 2.30 | -6.95 | 9.24 | |||
| 1985 | 23.69 | 31.86 | 31.02 | 0.84 | 32.34 | 32.18 | 0.16 | 37.39 | 22.70 | 14.69 | |||
| 1986 | 9.40 | 17.99 | 8.67 | 9.33 | 9.04 | 18.69 | -9.64 | 17.14 | 8.86 | 8.28 | |||
| 1987 | -3.64 | -4.32 | -3.06 | -1.26 | -8.14 | 2.79 | -10.93 | -0.60 | 3.26 | -3.86 | |||
| 1988 | 11.20 | 28.20 | 13.67 | 14.54 | 24.53 | 18.84 | 5.69 | 19.42 | 24.89 | -5.48 | |||
| 1989 | 20.06 | 23.76 | 27.62 | -3.86 | 18.24 | 30.65 | -12.42 | 34.73 | 6.87 | 27.87 | |||
| 1990 | -13.92 | -18.33 | -8.74 | -9.59 | -19.94 | -5.91 | -14.02 | -7.56 | -25.09 | 17.54 | |||
| 1991 | 28.04 | 34.21 | 48.11 | -13.90 | 46.79 | 30.95 | 15.85 | 53.77 | 39.19 | 14.58 | |||
| 1992 | 5.56 | 29.69 | 5.37 | 24.32 | 20.89 | 13.24 | 7.65 | 14.42 | 11.30 | 3.12 | |||
| 1993 | 8.69 | 24.67 | 5.74 | 18.93 | 19.40 | 13.40 | 6.00 | 27.01 | 3.53 | 23.48 | |||
| 1994 | -4.67 | -2.86 | -1.94 | -0.92 | -2.13 | -0.76 | -1.38 | -0.40 | -3.58 | 3.18 | |||
| 1995 | 30.07 | 35.06 | 33.22 | 1.84 | 30.20 | 37.77 | -7.58 | 40.99 | 23.09 | 17.90 | |||
| 1996 | 15.96 | 19.60 | 16.16 | 3.44 | 18.88 | 21.00 | -2.12 | 22.07 | 15.42 | 6.65 | |||
| 1997 | 25.08 | 33.05 | 20.40 | 12.65 | 27.03 | 31.69 | -4.66 | 32.44 | 20.65 | 11.79 | |||
| 1998 | 17.43 | 10.10 | 18.76 | -8.66 | -2.86 | 22.74 | -25.60 | 22.61 | -0.77 | 23.38 | |||
| 1999 | 20.58 | 3.73 | 37.44 | -33.71 | 25.84 | 11.04 | 14.80 | 45.67 | 11.08 | 34.60 | |||
| 2000 | -16.97 | 22.76 | -18.33 | 41.09 | 6.42 | 8.39 | -1.97 | -2.92 | -18.02 | 15.10 | |||
| 2001 | -15.12 | 11.23 | -7.26 | 18.49 | 13.33 | -5.56 | 18.88 | 5.19 | 0.72 | 4.47 | |||
| 2002 | -22.48 | -17.20 | -27.25 | 10.05 | -17.60 | -21.07 | 3.47 | -10.00 | -35.71 | 25.71 | |||
| 2003 | 32.12 | 46.02 | 41.37 | 4.66 | 56.49 | 28.73 | 27.76 | 41.12 | 65.58 | -24.47 | |||
| 2004 | 11.81 | 20.94 | 11.21 | 9.74 | 19.08 | 14.18 | 4.90 | 14.04 | 14.54 | -0.50 | |||
| 2005 | 4.34 | 10.80 | 1.85 | 8.95 | 5.88 | 8.12 | -2.24 | 14.73 | -0.74 | 15.47 | |||
| 2006 | 11.39 | 23.48 | 9.14 | 14.34 | 18.14 | 17.64 | 0.50 | 11.73 | 19.57 | -7.84 | |||
| 2007 | 2.65 | -4.02 | 8.47 | -12.49 | -2.72 | 5.50 | -8.22 | 11.98 | -9.40 | 21.38 | |||
| 2008 | -39.94 | -35.50 | -36.51 | 1.01 | -34.00 | -38.18 | 4.18 | -36.73 | -50.12 | 13.39 | |||
ANSWER
AQR Momentum Funds (A)
Course: Portfolio Management
Guideline Questions
- Should AQR launch its momentum fund
There are lot of styles of investing in the market such as growth, value or a mix of both. Momentum is a new type of style on which a lot of research paper have been published in the past but no one has actually implemented momentum strategy in its fund.
Momentum can be a powerful style of investing as it offers better return than the growth investing and is a better compliment to the value investing. As per the research papers published over the years it has been shown that growth investors can better if they shift some of their exposure to momentum strategies. The momentum portfolios performed better in absolute as well as relative terms.
In the case of value investing, value investing shows a lot of tracking error to core equity benchmark. As per the studies, value and mometum are negatively correlated which can used to an advantage by combining value and mometum to protect the downside.
AQR portfolios rarely consist exclusively of value stocks or growt stocks, it usually consist of both the strategies. Therefore, introduction of momentum investing will help the investor enhance the diversification of their portfolio at the same time increase the expected risk adjusted return.
- Do you believe the FF momentum factor (UMD/MOM) will have returns over the next decade that are significantly greater than zero, significantly less than zero or approximately zero?
Over the next decade the returns of the FF momnetum factor should be significantly greater than 0 as we can see that the returns have been cosnistently close to th average return values of 17.99%. Though it should also be observed that the ngative shocks below the average return value have also increased and that would mean that the clients should not be alarmed by the lower and even negative return in any given period as that is part of the technique.

It will be dificult to comment on the significanc of the results as there is no significant relation between the results’ regression with time. We can seete regression output below and that shows that the result are ore randomly scattered than following any regression line. The difference in the intercept is due to the actual years being taken as the x co-ordinates. A positive slope also states that the returns might increase in the future.
|
||||||||||
|
Regression Statistics |
||||||||||
|
Multiple R |
0.009747 |
|||||||||
|
R Square |
9.5E-05 |
|||||||||
|
Adjusted R Square |
-0.0124 |
|||||||||
|
Standard Error |
21.34293 |
|||||||||
|
Observations |
82 |
|||||||||
|
ANOVA |
||||||||||
|
df |
SS |
MS |
F |
Significance F |
||||||
|
Regression |
1 |
3.462421 |
3.462421 |
0.007601 |
0.930743 |
|||||
|
Residual |
80 |
36441.66 |
455.5207 |
|||||||
|
Total |
81 |
36445.12 |
||||||||
|
Coefficients |
Standard Error |
t Stat |
P-value |
Lower 95% |
Upper 95% |
Lower 95.0% |
Upper 95.0% |
|||
|
Intercept |
0.910473 |
195.9307 |
0.004647 |
0.996304 |
-389.004 |
390.8249 |
-389.004 |
390.8249 |
||
|
X Variable 1 |
0.008681 |
0.099576 |
0.087184 |
0.930743 |
-0.18948 |
0.206845 |
-0.18948 |
0.206845 |
||
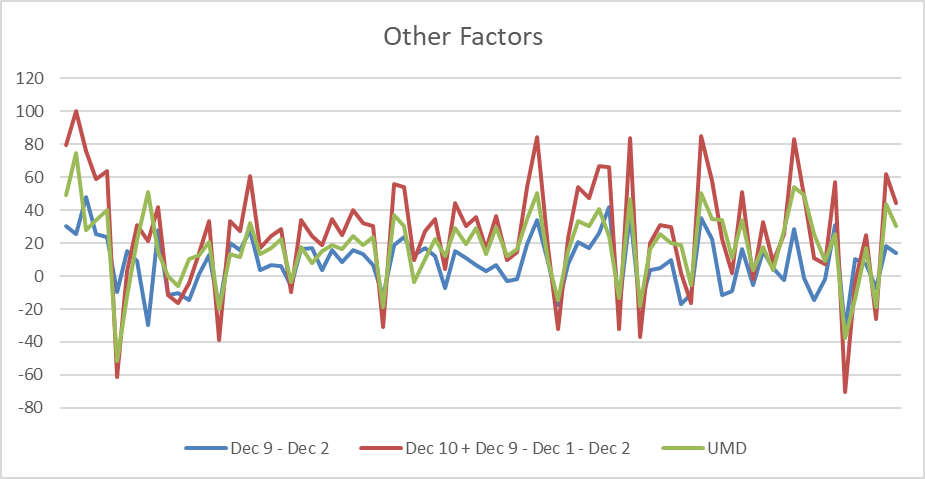
- Compare the UMD factor to other specifications for momentum (e.g. Dec10 — Dec1, or [(Dec10+Dec9)-(Dec1+Dec2)], or . . . ). Does this affect your beliefs in 2 above?
On comparison with other factors we can see that a pure factor (UMD and Dec9 – Dec2) give lower outputs when compared to a factor made of multiple deciles. Even the average returns are better in case of a composed factor:
|
Dec 9 – Dec 2 |
Dec 10 + Dec 9 – Dec 1 – Dec 2 |
UMD |
|
|
Average |
8.08 |
26.07 |
17.99 |
The shocks are much higher in case of a composed fator but the returns should be able to account for the higher risk associated with such returns.
| Year | Dec 9 – Dec 2 | Dec 10 + Dec 9 – Dec 1 – Dec 2 | UMD |
| 1927 | 30.37 | 79.32 | 48.95 |
| 1928 | 25.49 | 100.1 | 74.61 |
| 1929 | 48.09 | 75.81 | 27.72 |
| 1930 | 25.48 | 59.19 | 33.71 |
| 1931 | 23.56 | 63.84 | 40.28 |
| 1932 | -9.9 | -61.38 | -51.48 |
| 1933 | 14.97 | 2.82999999999998 | -12.14 |
| 1934 | 8.84 | 30.84 | 22 |
| 1935 | -29.88 | 21.07 | 50.95 |
| 1936 | 27.71 | 42.14 | 14.43 |
| 1937 | -11.55 | -11.64 | -0.09 |
| 1938 | -10.22 | -16.5 | -6.28 |
| 1939 | -14.76 | -4.34 | 10.42 |
| 1940 | 1.13 | 14.14 | 13.01 |
| 1941 | 12.48 | 33.2 | 20.72 |
| 1942 | -19.27 | -39.06 | -19.79 |
| 1943 | 19.87 | 33.48 | 13.61 |
| 1944 | 15.93 | 27.58 | 11.65 |
| 1945 | 28.05 | 60.46 | 32.41 |
| 1946 | 3.76 | 16.95 | 13.19 |
| 1947 | 6.97 | 24.27 | 17.3 |
| 1948 | 5.96 | 28.73 | 22.77 |
| 1949 | -6.18 | -9.65 | -3.47 |
| 1950 | 16.32 | 34.21 | 17.89 |
| 1951 | 16.91 | 24.57 | 7.66 |
| 1952 | 3.65 | 18.91 | 15.26 |
| 1953 | 15.6 | 34.67 | 19.07 |
| 1954 | 8.49 | 25.11 | 16.62 |
| 1955 | 15.62 | 40.17 | 24.55 |
| 1956 | 13.09 | 31.98 | 18.89 |
| 1957 | 6.42 | 30.29 | 23.87 |
| 1958 | -12.39 | -31.13 | -18.74 |
| 1959 | 18.59 | 55.76 | 37.17 |
| 1960 | 23.58 | 54.15 | 30.57 |
| 1961 | 13.03 | 9.43 | -3.6 |
| 1962 | 17.02 | 27.49 | 10.47 |
| 1963 | 12.32 | 34.52 | 22.2 |
| 1964 | -7.35 | 4.57 | 11.92 |
| 1965 | 14.99 | 44.29 | 29.3 |
| 1966 | 10.87 | 30.6 | 19.73 |
| 1967 | 6.61 | 36.05 | 29.44 |
| 1968 | 3.16 | 16.68 | 13.52 |
| 1969 | 6.68 | 36.69 | 30.01 |
| 1970 | -2.8 | 9.46 | 12.26 |
| 1971 | -1.77 | 14.67 | 16.44 |
| 1972 | 19.66 | 54.04 | 34.38 |
| 1973 | 34.27 | 84.47 | 50.2 |
| 1974 | 8.46 | 17.31 | 8.85 |
| 1975 | -17.63 | -32.22 | -14.59 |
| 1976 | 7.59 | 23.07 | 15.48 |
| 1977 | 20.93 | 54.3 | 33.37 |
| 1978 | 16.88 | 47.45 | 30.57 |
| 1979 | 26.25 | 66.84 | 40.59 |
| 1980 | 41.83 | 65.98 | 24.15 |
| 1981 | -18.65 | -31.97 | -13.32 |
| 1982 | 37.57 | 84.04 | 46.47 |
| 1983 | -18.97 | -36.97 | -18 |
| 1984 | 3.8 | 20.34 | 16.54 |
| 1985 | 5.05 | 30.71 | 25.66 |
| 1986 | 9.73 | 30.04 | 20.31 |
| 1987 | -17.16 | 1.72 | 18.88 |
| 1988 | -10.96 | -16.24 | -5.28 |
| 1989 | 35.1 | 85.29 | 50.19 |
| 1990 | 22.78 | 57.68 | 34.9 |
| 1991 | -11.52 | 22.59 | 34.11 |
| 1992 | -9.31 | 1.83 | 11.14 |
| 1993 | 16.63 | 50.9 | 34.27 |
| 1994 | -5.24 | -1.86 | 3.38 |
| 1995 | 15 | 32.66 | 17.66 |
| 1996 | 4.77 | 8.42 | 3.65 |
| 1997 | -2.28 | 25.58 | 27.86 |
| 1998 | 28.74 | 82.97 | 54.23 |
| 1999 | -0.91 | 48.34 | 49.25 |
| 2000 | -14.57 | 11.11 | 25.68 |
| 2001 | -1.84 | 7.26 | 9.1 |
| 2002 | 31.15 | 56.9 | 25.75 |
| 2003 | -32.71 | -70.44 | -37.73 |
| 2004 | 10.53 | -3.62 | -14.15 |
| 2005 | 7.38 | 24.64 | 17.26 |
| 2006 | -7.36 | -25.86 | -18.5 |
| 2007 | 18.03 | 61.65 | 43.62 |
| 2008 | 14.12 | 44.49 | 30.37 |
| Average | 8.08 | 26.07 | 17.99 |
| Dec 9 – Dec 2 | Dec 10 + Dec 9 – Dec 1 – Dec 2 | UMD | |
| 8.08 | 26.07 | 17.99 |
- What are the appropriate benchmarks for AQR’s momentum funds? Would you expect the net performance of the funds to exceed these benchmarks? Why or why not?
The biggest problem with the AQR momentum fund would be to select a benchmark for the fund. There are no momentum fund in the market. Therefore it would be real problem to select a benchmark.
Index can be taken as per the stocks under the Momentum Fund, suppose AQR decides to take 1000 largest stocks in the momentum fund than the index for the same could be Russell 1000 value and growth. Similarly, for small cap momentum fund the index could be Russell 2000 value and growth.
- The advantageous correlation structure in Exhibit 5 is seen as a key advantage of the fund. Is this the right way to think about the risk of the funds? If not use the data to construct more informative risk characteristics of the funds. Does this affect AQR’s story?
The UMD has a very low correlation with the factors such as SMB and HML of -.09 and -.30 respectively. This implies that they do not move in the same direction which results in a very good diversification of the fund. On the other U has a high correlation with the market facctors. Which in itself is bad for the investors as investors would think why they need to spend more money when they can just replicate the index. Therefore, AQR has to show it to the investor that U is able to outperform the M to get more investors on board. Also, among all the factors UMD has the highest mean return with the lowest stanadard deviation which means that the return from AQR momentum fund would be able to give higher risk adjusted return.
- Does momentum make and attractive product for retail mutual fund investors?
Momentum fund can be or cannot be an attractive product for retail investors. It bascially depends on the behaviour of the retail investors and the wealth they posses. If you are a small retail investor with less apetite to take risk you should not go for this fund as the this fund is not proven yet and is to the market. But if you are weathly and have some ability to take risk than this could be a great earning opportunity for you. But before you decide to invest in momentum fund you need to decide its benchmark as it would first of its kind and thus would be hard to compare this fund to.
- How should AQR mange its momentum funds in its objective to maximize returns while minimize its tracking error.
Tracking error is the standard deviaton of the difference of the returns of a fund and its benchmark. The best way AQR can maximize the return while keeping the tracking error low is by keeping the transaction cost as low as possible.
- Which potential clients should AQR target with the fund?
For starter purpose AQR should not go for the retail clients. They should target High Net Worth individuals, institutional investors and other wealthy clients.
Looking for best Finance Assignment Help. Whatsapp us at +16469488918 or chat with our chat representative showing on lower right corner or order from here. You can also take help from our Live Assignment helper for any exam or live assignment related assistance.