QUESTION
- Use Microsoft® Excel® to calculate the defined process metrics including variation and process capability.
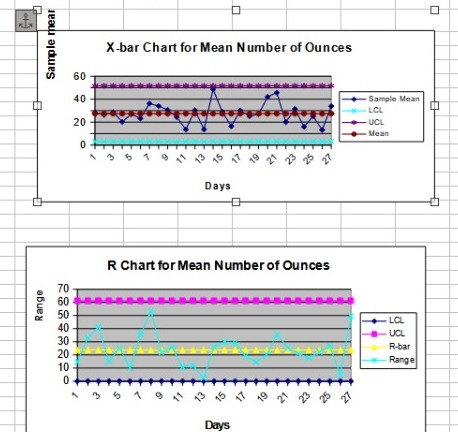
- Use Microsoft® Excel® and PowerPoint® to develop and display a control chart for the process.
SPC Explanation
Here an example is taken for daily measurement of a juice center you visit regularly after your school. Out of your curiosity and as part of an experiment advised by your professor you wanted to perform an experiment by collecting daily 3 number of samples from the juice shop and randomly form any customer glasses and want to measure the amount of juice being poured in the juice glass. You also want to establish a standard for the juice center and want to make the shop owner know, whether his shop is under process control or not
I have taken 27 days data for 3 random samples each days and measured the content in the juice container. The data is provided in the excel sheet for calculation purpose.
Executive Summary
Under SPC, a process behaves predictably to produce as much conforming product as possible with the least possible waste. While SPC has been applied most frequently to controlling manufacturing lines, it applies equally well to any process with a measurable output
SPC is method of measuring and controlling the quality of a process by use of common statistical analysis and calculating the process capability. The process can be applicable to each and every process which can be monitored using some methods. There are two types of SPC process which are SPC for attributes and SPC for variables. The dimensions which are measurable the PSC for variables is applicable in that. The process which is taken in the example is a measurable event and therefore the SPC for variable is selected and an x-bar and R-chart is formulated.
The chart is shown below
We can easily calculate the standard deviation of the process we measured
Putting the value we get the standard deviation = 14.06
Cp = (USL – LSL) / 6 sigma
The USL and LSL you set as 27.5 to 50.5
So when we calculate the Cp = 0.272
Cp<1 means the process variation exceeds specification, and a significant number of defects are being made.
Cp=1 means that the process is just meeting specifications. A minimum of .3% defects will be made and more if the process is not centered.
Cp>1 means that the process variation is less than the specification, however, defects might be made if the process is not centered on the target value.
Though the control chart shows that the process is under control form the samples we collected for our experiment. That means the process is not capable enough to provide the exact value in future.
Process Capability Studies are designed to see what the process is “capable” of doing under controlled conditions. The studies look at how capable the process is given ideal conditions over a short period of time. Statistical tools helps in analyzing the process thoroughly and also predict the future of the process. This also helps the quality people as well as the process owners to rectify the methodology if some error is there. The charts which can be used to calculate attributes are P-chart, C-chart etc. This can also be used for the daily schedule of any process which needs to study for some improvement.
The SPC is useful when there is service as well as manufacturing type process and also even daily routine checks for any activity.
Samples
| # of ounces in container | |||||
| Sample | 1 | 2 | 3 | Sample Mean | Range |
| 1 | 24.0 | 23.1 | 37.6 | 28.2 | 14.6 |
| 2 | 17.2 | 47.4 | 14.5 | 26.4 | 33.0 |
| 3 | 18.2 | 54.6 | 13.4 | 28.7 | 41.2 |
| 4 | 20.8 | 12.5 | 27.4 | 20.2 | 14.9 |
| 5 | 17.0 | 42.1 | 21.8 | 27.0 | 25.1 |
| 6 | 20.8 | 29.5 | 19.2 | 23.2 | 10.3 |
| 7 | 19.7 | 55.3 | 33.7 | 36.2 | 35.6 |
| 8 | 22.9 | 12.9 | 66.3 | 34.0 | 53.4 |
| 9 | 28.5 | 20.9 | 42.6 | 30.7 | 21.7 |
| 10 | 16.1 | 41.4 | 15.6 | 24.4 | 25.8 |
| 11 | 13.4 | 19.0 | 8.1 | 13.5 | 10.8 |
| 12 | 25.6 | 37.4 | 28.1 | 30.4 | 11.8 |
| 13 | 14.2 | 14.4 | 12.2 | 13.6 | 2.3 |
| 14 | 60.9 | 49.8 | 34.8 | 48.5 | 26.1 |
| 15 | 47.1 | 22.7 | 17.3 | 29.1 | 29.8 |
| 16 | 4.3 | 33.4 | 11.6 | 16.4 | 29.1 |
| 17 | 23.8 | 42.9 | 23.8 | 30.2 | 19.1 |
| 18 | 20.5 | 34.8 | 20.3 | 25.2 | 14.5 |
| 19 | 28.3 | 15.9 | 36.2 | 26.8 | 20.3 |
| 20 | 60.2 | 24.5 | 41.5 | 42.0 | 35.7 |
| 21 | 38.0 | 37.0 | 62.3 | 45.8 | 25.4 |
| 22 | 30.0 | 21.1 | 8.9 | 20.0 | 21.1 |
| 23 | 38.9 | 21.2 | 34.5 | 31.5 | 17.7 |
| 24 | 8.0 | 9.7 | 30.1 | 15.9 | 22.1 |
| 25 | 38.4 | 11.7 | 25.4 | 25.1 | 26.7 |
| 26 | 15.2 | 14.0 | 10.3 | 13.2 | 4.9 |
| 27 | 6.4 | 55.9 | 39.5 | 33.9 | 49.4 |
X Bar and R Chart
| Sample | Sample Mean | Range |
| 1 | 28.2 | 14.6 |
| 2 | 26.4 | 33.0 |
| 3 | 28.7 | 41.2 |
| 4 | 20.2 | 14.9 |
| 5 | 27.0 | 25.1 |
| 6 | 23.2 | 10.3 |
| 7 | 36.2 | 35.6 |
| 8 | 34.0 | 53.4 |
| 9 | 30.7 | 21.7 |
| 10 | 24.4 | 25.8 |
| 11 | 13.5 | 10.8 |
| 12 | 30.4 | 11.8 |
| 13 | 13.6 | 2.3 |
| 14 | 48.5 | 26.1 |
| 15 | 29.1 | 29.8 |
| 16 | 16.4 | 29.1 |
| 17 | 30.2 | 19.1 |
| 18 | 25.2 | 14.5 |
| 19 | 26.8 | 20.3 |
| 20 | 42.0 | 35.7 |
| 21 | 45.8 | 25.4 |
| 22 | 20.0 | 21.1 |
| 23 | 31.5 | 17.7 |
| 24 | 15.9 | 22.1 |
| 25 | 25.1 | 26.7 |
| 26 | 13.2 | 4.9 |
| 27 | 33.9 | 49.4 |
| Mean | 27.41467 | 23.7969391496618 |
| Control Limits, X-bar Chart | ||
| LCL | UCL | Mean |
| 3.14179130370633 | 51.6875471690164 | 27.4146692363614 |
| 3.14179130370633 | 51.6875471690164 | 27.4146692363614 |
| 3.14179130370633 | 51.6875471690164 | 27.4146692363614 |
| 3.14179130370633 | 51.6875471690164 | 27.4146692363614 |
| 3.14179130370633 | 51.6875471690164 | 27.4146692363614 |
| 3.14179130370633 | 51.6875471690164 | 27.4146692363614 |
| 3.14179130370633 | 51.6875471690164 | 27.4146692363614 |
| 3.14179130370633 | 51.6875471690164 | 27.4146692363614 |
| 3.14179130370633 | 51.6875471690164 | 27.4146692363614 |
| 3.14179130370633 | 51.6875471690164 | 27.4146692363614 |
| 3.14179130370633 | 51.6875471690164 | 27.4146692363614 |
| 3.14179130370633 | 51.6875471690164 | 27.4146692363614 |
| 3.14179130370633 | 51.6875471690164 | 27.4146692363614 |
| 3.14179130370633 | 51.6875471690164 | 27.4146692363614 |
| 3.14179130370633 | 51.6875471690164 | 27.4146692363614 |
| 3.14179130370633 | 51.6875471690164 | 27.4146692363614 |
| 3.14179130370633 | 51.6875471690164 | 27.4146692363614 |
| 3.14179130370633 | 51.6875471690164 | 27.4146692363614 |
| 3.14179130370633 | 51.6875471690164 | 27.4146692363614 |
| 3.14179130370633 | 51.6875471690164 | 27.4146692363614 |
| 3.14179130370633 | 51.6875471690164 | 27.4146692363614 |
| 3.14179130370633 | 51.6875471690164 | 27.4146692363614 |
| 3.14179130370633 | 51.6875471690164 | 27.4146692363614 |
| 3.14179130370633 | 51.6875471690164 | 27.4146692363614 |
| 3.14179130370633 | 51.6875471690164 | 27.4146692363614 |
| 3.14179130370633 | 51.6875471690164 | 27.4146692363614 |
| 3.14179130370633 | 51.6875471690164 | 27.4146692363614 |
| Control Limits, R Chart | |||
| LCL | UCL | R-bar | Range |
| 0 | 61.1581336146309 | 23.7969391496618 | 14.6 |
| 0 | 61.1581336146309 | 23.7969391496618 | 33.0 |
| 0 | 61.1581336146309 | 23.7969391496618 | 41.2 |
| 0 | 61.1581336146309 | 23.7969391496618 | 14.9 |
| 0 | 61.1581336146309 | 23.7969391496618 | 25.1 |
| 0 | 61.1581336146309 | 23.7969391496618 | 10.3 |
| 0 | 61.1581336146309 | 23.7969391496618 | 35.6 |
| 0 | 61.1581336146309 | 23.7969391496618 | 53.4 |
| 0 | 61.1581336146309 | 23.7969391496618 | 21.7 |
| 0 | 61.1581336146309 | 23.7969391496618 | 25.8 |
| 0 | 61.1581336146309 | 23.7969391496618 | 10.8 |
| 0 | 61.1581336146309 | 23.7969391496618 | 11.8 |
| 0 | 61.1581336146309 | 23.7969391496618 | 2.3 |
| 0 | 61.1581336146309 | 23.7969391496618 | 26.1 |
| 0 | 61.1581336146309 | 23.7969391496618 | 29.8 |
| 0 | 61.1581336146309 | 23.7969391496618 | 29.1 |
| 0 | 61.1581336146309 | 23.7969391496618 | 19.1 |
| 0 | 61.1581336146309 | 23.7969391496618 | 14.5 |
| 0 | 61.1581336146309 | 23.7969391496618 | 20.3 |
| 0 | 61.1581336146309 | 23.7969391496618 | 35.7 |
| 0 | 61.1581336146309 | 23.7969391496618 | 25.4 |
| 0 | 61.1581336146309 | 23.7969391496618 | 21.1 |
| 0 | 61.1581336146309 | 23.7969391496618 | 17.7 |
| 0 | 61.1581336146309 | 23.7969391496618 | 22.1 |
| 0 | 61.1581336146309 | 23.7969391496618 | 26.7 |
| 0 | 61.1581336146309 | 23.7969391496618 | 4.9 |
| 0 | 61.1581336146309 | 23.7969391496618 | 49.4 |
| 23.7969391496618 | |||
| Factors | ||||
| n | A2 | D3 | D4 | d2 |
| 3 | 1.02 | 0 | 2.57 | 1.693 |
Looking for Operation Management Assignment Help. Whatsapp us at +16469488918 or chat with our chat representative showing on lower right corner or order from here. You can also take help from our Live Assignment helper for any exam or live assignment related assistance.