QUESTION
http://pages.stern.nyu.edu/~adamodar/New_Home_Page/datacurrent.html
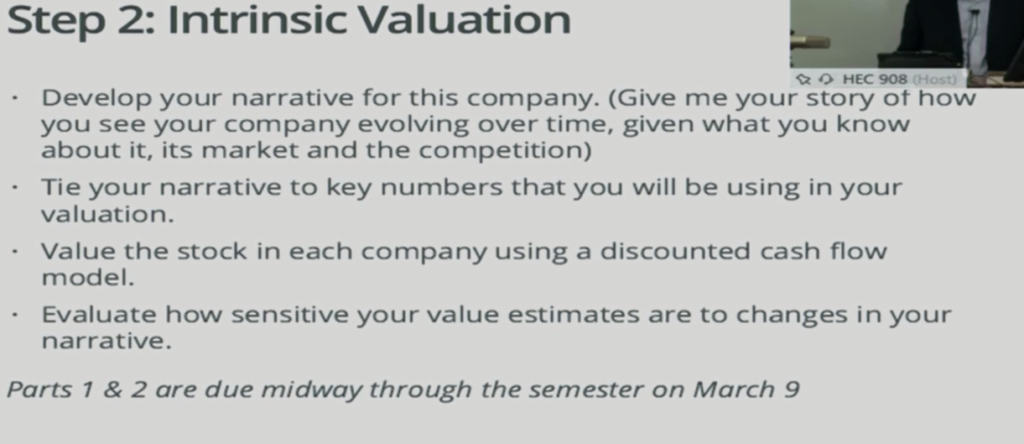
Once you have decided the company you are going to value, this is the next step.
-
Describe the company
-
Give some background and history of the company
-
Talk about the company’s operations
-
Talk about the market in which the company operates
-
Talk about the company competition
-
The overall industry in which the company is operating
-
Tie this narrative to certain key numbers that I am going to be using in the evaluation
-
For example, if I am going to talk about a company where I anticipate the short-term growth on an annual basis of revenue for the company is going to be a 7% per year. Describe what is the company doing, how is the company operating that is going to allow it to grow at 7% a year. If for example, the industry says is only anticipating in growing 3% per, then explain what they are doing different.
-
Develop your DCF you will value the equity or the common stock in the company as part of the valuation process.
-
Then show a sensitivity analysis. What would cause the value of the stock to go upward or downward based upon certain parameters or assumptions being made.
-
Which of these inputs will cause the most significant change? Or those that may just result only on a marginal value.
-
When you value the company you need to value using the company’s own cash flow.
-
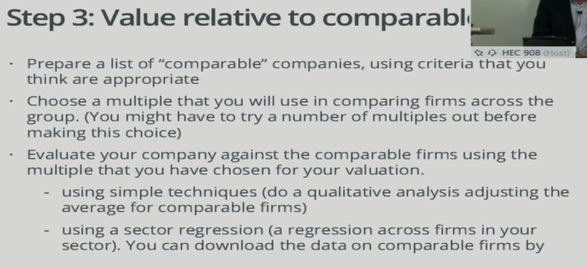
Also going then are going to value the company relatively on certain comparable. This would be on a market approach.
-
What we are looking at is at other companies that are very similar to the company I chose and we look at what their values are. These are probably traded company’s.
-
Determine what value multiple I am going to find from the comparable company would be appropriate to apply to the subject property.
-
Using the multiple value, qualitive analysis.
-
Using a sector regression, basically a regression analysis about firms operating within that industry and then tie that to the subject company as well.
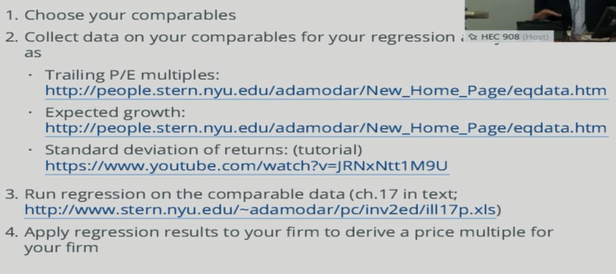
There are a number of links below:
-
These sites will help me develop all of the multiples need for the project
-
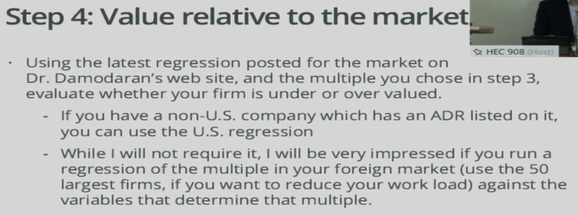
Determine if the firm is overvalued or undervalue.
-
ADP (American Domestic Depository Receipt)
-
If you happen to have a company that has negative earnings and may be high debt to capital ratio for example, then the valuation methodology that you might use would be an option pricing model.
-
Wrapping all of this up
ANSWER
DCF Valuation Relative Valuation
Company Price Model Value Multiple Value Opinion
Texas Roadhouse $ 63.80 FCFF Gen $ 53.11 PE $ 47.89 SELL
Index
- Overview of the company
- DCF Valuation
- Relative Valuation
- Market Valuation
- Final Analysis
Texas Roadhouse
- Company Overview- Source https://en.wikipedia.org/wiki/Texas_Roadhouse
Headquartered in Louisville, Kentucky, operating 563 locations in 49 U.S states, and Saudi Arabia, Kuwait, Bahrain, the United Arab Emirates, Qatar, the Philippines, Mexico, and Taiwan, Texas Roadhouse (TXRH) is an American chain restaurant that specializes in steaks. It was founded in 1993 by W. Kent Taylo. American cuisine, including steak, ribs, chicken, and seafood is served by waiters, waitresses and hosts perform these dances throughout the night.
Having a net profit of $158.22 Million and market capitalisation of $ 4.29 b, the company is growing its revenue at an average rate of 11% which is reported to be $ 2.46 Billion.
- DCF Valuation
Using one stage stable growth model using the growth rate of the company which is nearly equating with the growth of restaurant companies.
The factual of the DCF valuation are as under:
(Some insight on DCF, CAPM and WACC- Before you start first of all lets have some understanding of DCF- Discounted cash flow gives you the present value of future cash flows, say if you are going to earn $ 55000 per annum for whole of your life and the interest rates in US are say, 3% you worth on this day is $55000/.03= $1.8333 Million, look you are already a millionaire.
Similarly company’s EBIT are its earning and interest rate is nothing but opportunity cost of funds which is cost of capital.
Cost of Capital is weighted average cost of factors of capital.
Cost of debt is % age of interest paid on debt
Cost of equity is expected return by shareholders.
Cost of equity is found by Capital asset pricing model.
Which is based on the concept that how much extra return an investor wants if he is taking the risk, Beta.
So simply with 0 risk investor can get treasury rate returns which is risk free rate and with risk as 1 i.e. market risk investor can get some return over risk free return that is market premium which is Market risk – risk free premium. This Market risk premium multiplied by beta gives you that extra return which investor wants after taking risk. Hence CAPM= Rf +Market risk Premium X Beta.
That’s all.)
(Amount in Million)
|
Growth rate- https://www.rewardsnetwork.com/industry-trends/2018-restaurant-trends-industry/ |
4% |
|
Debt ratio-https://www.macrotrends.net/stocks/charts/TXRH/texas-roadhouse/financial-ratios |
6.11% |
|
Beta-https://finbox.io/TXRH/explorer/beta |
0.87 |
|
Risk Free rate-http://people.stern.nyu.edu/adamodar/pdfiles/papers/riskfreerate.pdf |
4.25% |
|
Risk premium-http://www.market-risk-premia.com/us.html (2018- considered) |
4% |
|
Cost of debt- ($1.577 M/$ 52.269M)-(interest/debt)- https://www.gurufocus.com/term/wacc/TXRH/WACC-/Texas-Roadhouse-Inc |
3.02% |
|
Tax Rate-https://ycharts.com/companies/TXRH/effective_tax_rate |
15.46% |
|
Return on capital-https://www.gurufocus.com/term/ROIC/STU:ROW/ROIC-/Texas-Roadhouse-Inc |
21.32% |
|
Reinvestment Rate-https://www.reuters.com/finance/stocks/financial-highlights/TXRH.O-(1-Payout Ratio)- Payout Ratio, taken as 40% -Average. Reinvestment rate is the percentage of profit not distributed and invested back in the company. |
60% |
|
Cost of Equity- Derived From CAPM model (Rf+ Risk PremiumX Beta) |
7.7300% |
|
Cost Of Capital WACC= Weight of Debt x Cost of Debt + Weight of Equity x Cost of Equity Weight of Debt = Debt Ratio/1+ Debt ratio Weight of Equity= 1- Weight of debt |
7.64% |
|
EBIT ($ Million) |
$ 290.78 M |
|
EQUITY VALUE- EBIT/cost of capital – Debt |
$ 3741.306 M |
|
FIRM VALUE= Equity Value+Debt |
$ 3807.656 M |
|
SHARE Outstanding https://www.nasdaq.com/symbol/txrh/stock-report |
71.69 |
|
Share Value- Equity Value/ Share outstanding |
$ 53.11 |
|
Current Price-google |
$ 63.08 |
Sensitivity Analysis
The Key driver of TXRH is its increasing growth rate.
(Growth rate falls down, the cost of equity will change, which plays a major part in cost of capital as weight of equity is way more higher than weight of debt)
- Relative Valuation
(Model used is PE- PE is price to earning factor= Price of share / Earning per share(EPS). EPS= EBIT/ Number of shares outstanding)
As TXRH is having maximum of its branches in America, the restaurant chains of America are selected for the relative valuation. Selected companies included Darden Restaurant, Cracker Barrel Old Ctry store, Ruth Hospitality, Wendy’s co and Bloomin’ Brands Inc. etc. (Data From-https://www.thestreet.com/topic/25862/top-rated-equity-restaurants-and-hotels.html)
-
Company Name
PE Ratio
Darden Restr.
20.80
Cracker Barrel.
21.20
Ruth Hospitality
18.55
Wendy’s Co
9.22
Bloomin’ Brands Inc.
18.14
Whereas TXRH’s PE ratio is 28.78.
After analysis, PE ratio of 15 chain restaurant stocks comparable, the PE ratio for restaurant industry is found to be 21.7. (Intercept Value from Regression analysis was taken as PE) (I have used capital and PE ratios of few companies and ran a regression model, results are on excel sheet)
Earning per share of TXRH is $2.207 ($158.227/71.69) /(Earnings / Number of shares Outstanding)
Using PE ratio as a factor the Value of stock shall stand at $2.207 X 21.7 = $47.89.
The result is consistent with the DCF analysis, and shows that the stock is overpriced.
- Market Valuation
Restaurant Brands (QSR) as on 1st March 2019 is having a PE ratio of 24.13, using a regression model.
Using the PE ratio to the earnings of TXRH, we have value of stock as $ 2.207 X 24.13 = $ 53.257.
https://www.macrotrends.net/stocks/charts/QSR/restaurant-brands/pe-ratio (PE ratio Available)
- Final Analysis
-
Current Price
$ 63.08
DCF Value
$ 53.11
PE Ratio of TXRH
28.78
PE Ratio of Comparable
21.7
PE Ratio of Market
24.13
Average Value of share
$ 51.42
Using equal weights for the value derived from all the three models, the valuation of share of TXRH comes out to be $ 32.34.
Current share price is way much higher than the derived valuation as PE ratio is also suggesting the same.
Lastly, opining from the analysis it is recommended to sell the stock.
(If value of stock is lower than the current market price it is expected to come down, so if you are holding the shares you should sell it in such circumstances or else you can short sell them on current date and buy at the later period when prices falls which will allow you to make profits- that’s trading on downfall)
Regression
| Capital $ billion | PE | Company | https://www. | macrotrendsnet/stocks/charts/QSR/restaurant-brands/pe-ratio | |
| United States | 141.208 | 23.33 | Mc Donalds | ||
| United States | 88.669 | 28.29 | 33Starbucks (S | ||
| United States | 29.79 | 30.19 | 29Yum! | ||
| United States | 16.601 | 67.59 | 19Chipotle Mexican Grill (CMG | ||
| China | 15.739 | 27.32 | 59Yum China Holdings (YUMC | ||
| United States | 13.803 | 20.85 | 32Darden Restaurants (DRI | ||
| United States | 10.844 | 31 | 85Domino’s Pizza Inc (DPZ | ||
| United States | 5.919 | 24.71 | 00Dunkin’ | ||
| United States | 4.483 | 28.48 | 71Texas Roadhouse (TXRH | ||
| United States | 4.196 | 30.55 | 48Wendy’s (WEN | RL | |
| United States | 4.099 | 19.14 | 55Cracker | ||
| United States | 2.155 | 19.56 | 14Cheesecake Factory (CAKE | ||
| United States | 2.096 | 20.72 | 56Jack In | rands ( | LMN |
| United States | 2.016 | 14.72 | 72 | ||
| United States | 2.002 | 79.48 | 72Wingstop (WING | ||
| United States | 1.96 | 18.18 | 48Dave & | ||
| United States | 1.96 | 72.45 | 18Shake Shack (SHAK | ||
| United States | 0.779 | 18.06 | Ryth hos. | ||
| United States | 0.091 | 9.89 | Papa Morphy |
| SUMMARY OUTPUT | ||||||||
| Regression Statistics | ||||||||
| Multiple R | 0.069699028087623 | |||||||
| R Square | 0.004857954516359 | |||||||
| Adjusted R Square | -0.053679812865032 | |||||||
| Standard Error | 36.8892244169677 | |||||||
| Observations | 19 | |||||||
| ANOVA | ||||||||
| df | SS | MS | F | Significance F | ||||
| Regression | 1 | 112.931822969138 | 112.931822969138 | 0.082988380556235 | 0.776770422563886 | |||
| Residual | 17 | 23133.8529274519 | 1360.81487808541 | |||||
| Total | 18 | 23246.7847504211 | ||||||
| Coefficients | Standard Error | t Stat | P-value | Lower 95% | Upper 95% | Lower 95.0% | Upper 95.0% | |
| Intercept | 21.729492226935 | 15.9424269462631 | 1.39436061409368 | 0.181165615888266 | -11.4060884927606 | 55.8650729466306 | -11.4060884927606 | 55.8650729466306 |
| X Variable 1 | -0.126516830014482 | 0.439177069903984 | -0.288077039272889 | 0.776770422563888 | -1.0530994535251 | 0.800065793496134 | -1.0530994535251 | 0.800065793496134 |
Looking for best Finance Assignment Help. Whatsapp us at +16469488918 or chat with our chat representative showing on lower right corner or order from here. You can also take help from our Live Assignment helper for any exam or live assignment related assistance