QUESTION
Objective:
The objective of this final project is to give you an opportunity to apply what you are learning during lectures and tutorials towards a functional piece of software of your choosing. In addition to that, working in a group will aid in cementing your knowledge of Git, and give you an opportunity to apply what you learned.
Project Description:
This project will be completed in groups of 2-4 people. You will be required to self-assign yourselves to groups, anyone who is not in a group by February 1st will be penalized. The project will involve you proposing a piece of software that you think would be useful, it can be anything. Be sure to go through the list of topics that will be taught during lectures to see what features you can reasonably implement.
After your project plan is approved, you are expected to model and describe your potential software using a few different UML Diagrams. Next, in a collaborative environment using Git you are required to implement the software in Java.
Finally, you must ensure that you create documentation for your software, and include a report. The details will be given below.
Project Details:
-
You are required to submit at least 4 descriptive UML diagrams along with the functional software. (they can be any UML diagrams we learned in class or even ones you researched)
-
Implement your solution using Java.
-
Ensure that your code is commented, and that you are using Git (the logs have to be submitted in a separate PDF).
-
Test all potential paths in your software; this includes different types of input, erratic behavior, and edge cases. Your software must be able to handle errors gracefully. Screenshot testing, in addition to a description of the testing strategy is sufficient in a PDF.
-
Create documentation for your software, this is a separate file where all the methods are described, and the functionality and usage is described in detail. This means that I should know how to run it by reading your documentation.
-
Create your final project report which will include:
-
High overview of the software (usage, functionality, why would this be useful to someone).
-
Provide a description to the industry you would be targeting with this software. o Provide a detailed description of the software using your UML diagrams, accompanied by a brief description of what the diagram should be telling whoever is looking at it.
-
Provide a project retrospective
-
What was the easiest to implement?
-
What was the most difficult?
-
If you could go back would you do anything differently?
-
What have you learned?
-
-
I will be providing a formatting document so that it is easy for you to simply fill in this report.
-
The whole report should not be over 700 words.
-
Deliverables:
-
Runnable software files
-
Project Report (PDF)
-
Git Logs (screenshots for each group member in a PDF)
-
Testing Document (PDF)
-
Documentation (PDF, and include this with the software like a README file)
-
Submit all of the content above in a zip file
Please make sure you follow this naming convention: group_groupNumber_finalProject
Note:
This project is worth 20% of your overall course mark. Please ensure that you are working on it as you are learning material throughout the course.
I do not typically require peer evaluations because I think it is more work for everyone. However, if you are having a problem with your group let me know early and we can schedule a meeting early on as a group to resolve the situation.
In extreme cases were members of a group feel like other members did not contribute; documentation can be submitted as proof that other group members did not contribute, and their marks will be decreased to match their contribution.
ANSWER
Proposed Project
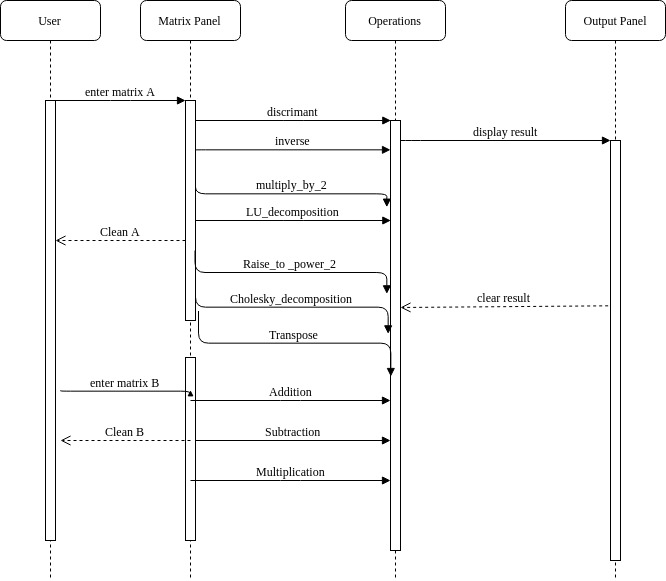
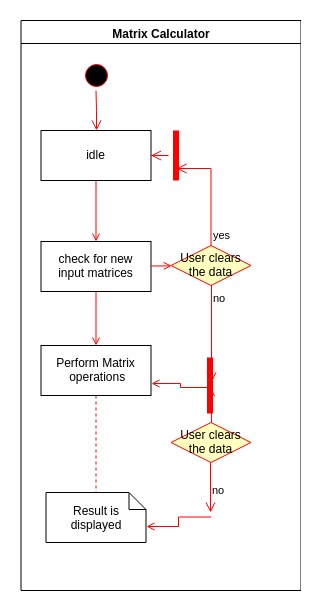
Matrix Calculator is a Java software that can be used to find the matrix determinant, the rank, raise the matrix to a power, find the sum and the multiplication of matrices, calculate the inverse matrix. It has the options to clean a particular input in case of errors. Also LU-Decomposition and Cholesky-Decomposition of matrices into two sub matrices can be done with it.
Programming Language(s) : Java
IDE to be used : Eclipse
GUI : Java Swing Class
The UML diagrams for the proposed project work are :
1) Class -Diagram

2) Sequence Diagram
3. Activity Diagram
4. Use Case Diagram

GUI Graph Calculator
We propose to implement a graphical calculator that is capable of plotting graphs for various algebraic and trignometric functions. We would be using Eclipse IDE for the development of the software. The programming language to be used is Java. The User Interface of the software will be built using the Java Swing Class. The members of the team would be connected using git and any commits/changes to the code would be clearly visible. Also the logs would also be maintained. The software would be platform independent and hence could be used on any Windows/Linux systems. In future work this software can be programmed to remember complex and frequently used graph plots and hence would provide suggestions while entering input functions.
Target Use
Most of the students studying in various colleges, universities, etc would directly benefit from the use of this graphical calculator. Various statistics analylsts would find the graphs of their data approximated to some functions using this GUI calculator. In various situations the equations are clear but the exact interpretation of how the function is behaving can be well understood by plotting graphs. Presence of local minima/maxima and global minima/maxima are of key importance in various situations. By varying the range and intervals of values these can easily be found. The GUI calculator is very useful in calculations of limit problems where function values may not be defined at a particular point but the limit exists. Asymtotes ( a line or a curve that approaches a given curve arbitrarily closely) are very useful in scientific computing where we can approximate a given function with a line. With the GUI calculator asymptotes can be easily observed.
Key Functionalities
-
Plotting of graph for various algebraic and trignometric equations.
-
Plotting of graph for ranges (A,B) specifically
-
Advanced features include solving of simultaneous equations
-
Plotting of graph for incremental intervals ( A, A+x, A+2x,…)
-
Manipulations of Algebraic Expressions such as simplify, expand
-
Display of accurate values without numerical approximations
-
Ease of using for various mathematical scenarious
-
Storing the graph as a jpeg image
Looking for best Computer Science Assignment Help. Whatsapp us at +16469488918 or chat with our chat representative showing on lower right corner or order from here. You can also take help from our Live Assignment helper for any exam or live assignment related assistance.