QUESTION
ANSWER
A study has been performed to compare the performance of two non-parametric methods (Histogram and Kernel Density Distribution in this case). Two scenarios have been considered for comparing the performance. The whole study has been divided into two parts – Data generation being the first one, and the Monte Carlo simulation being the second one.
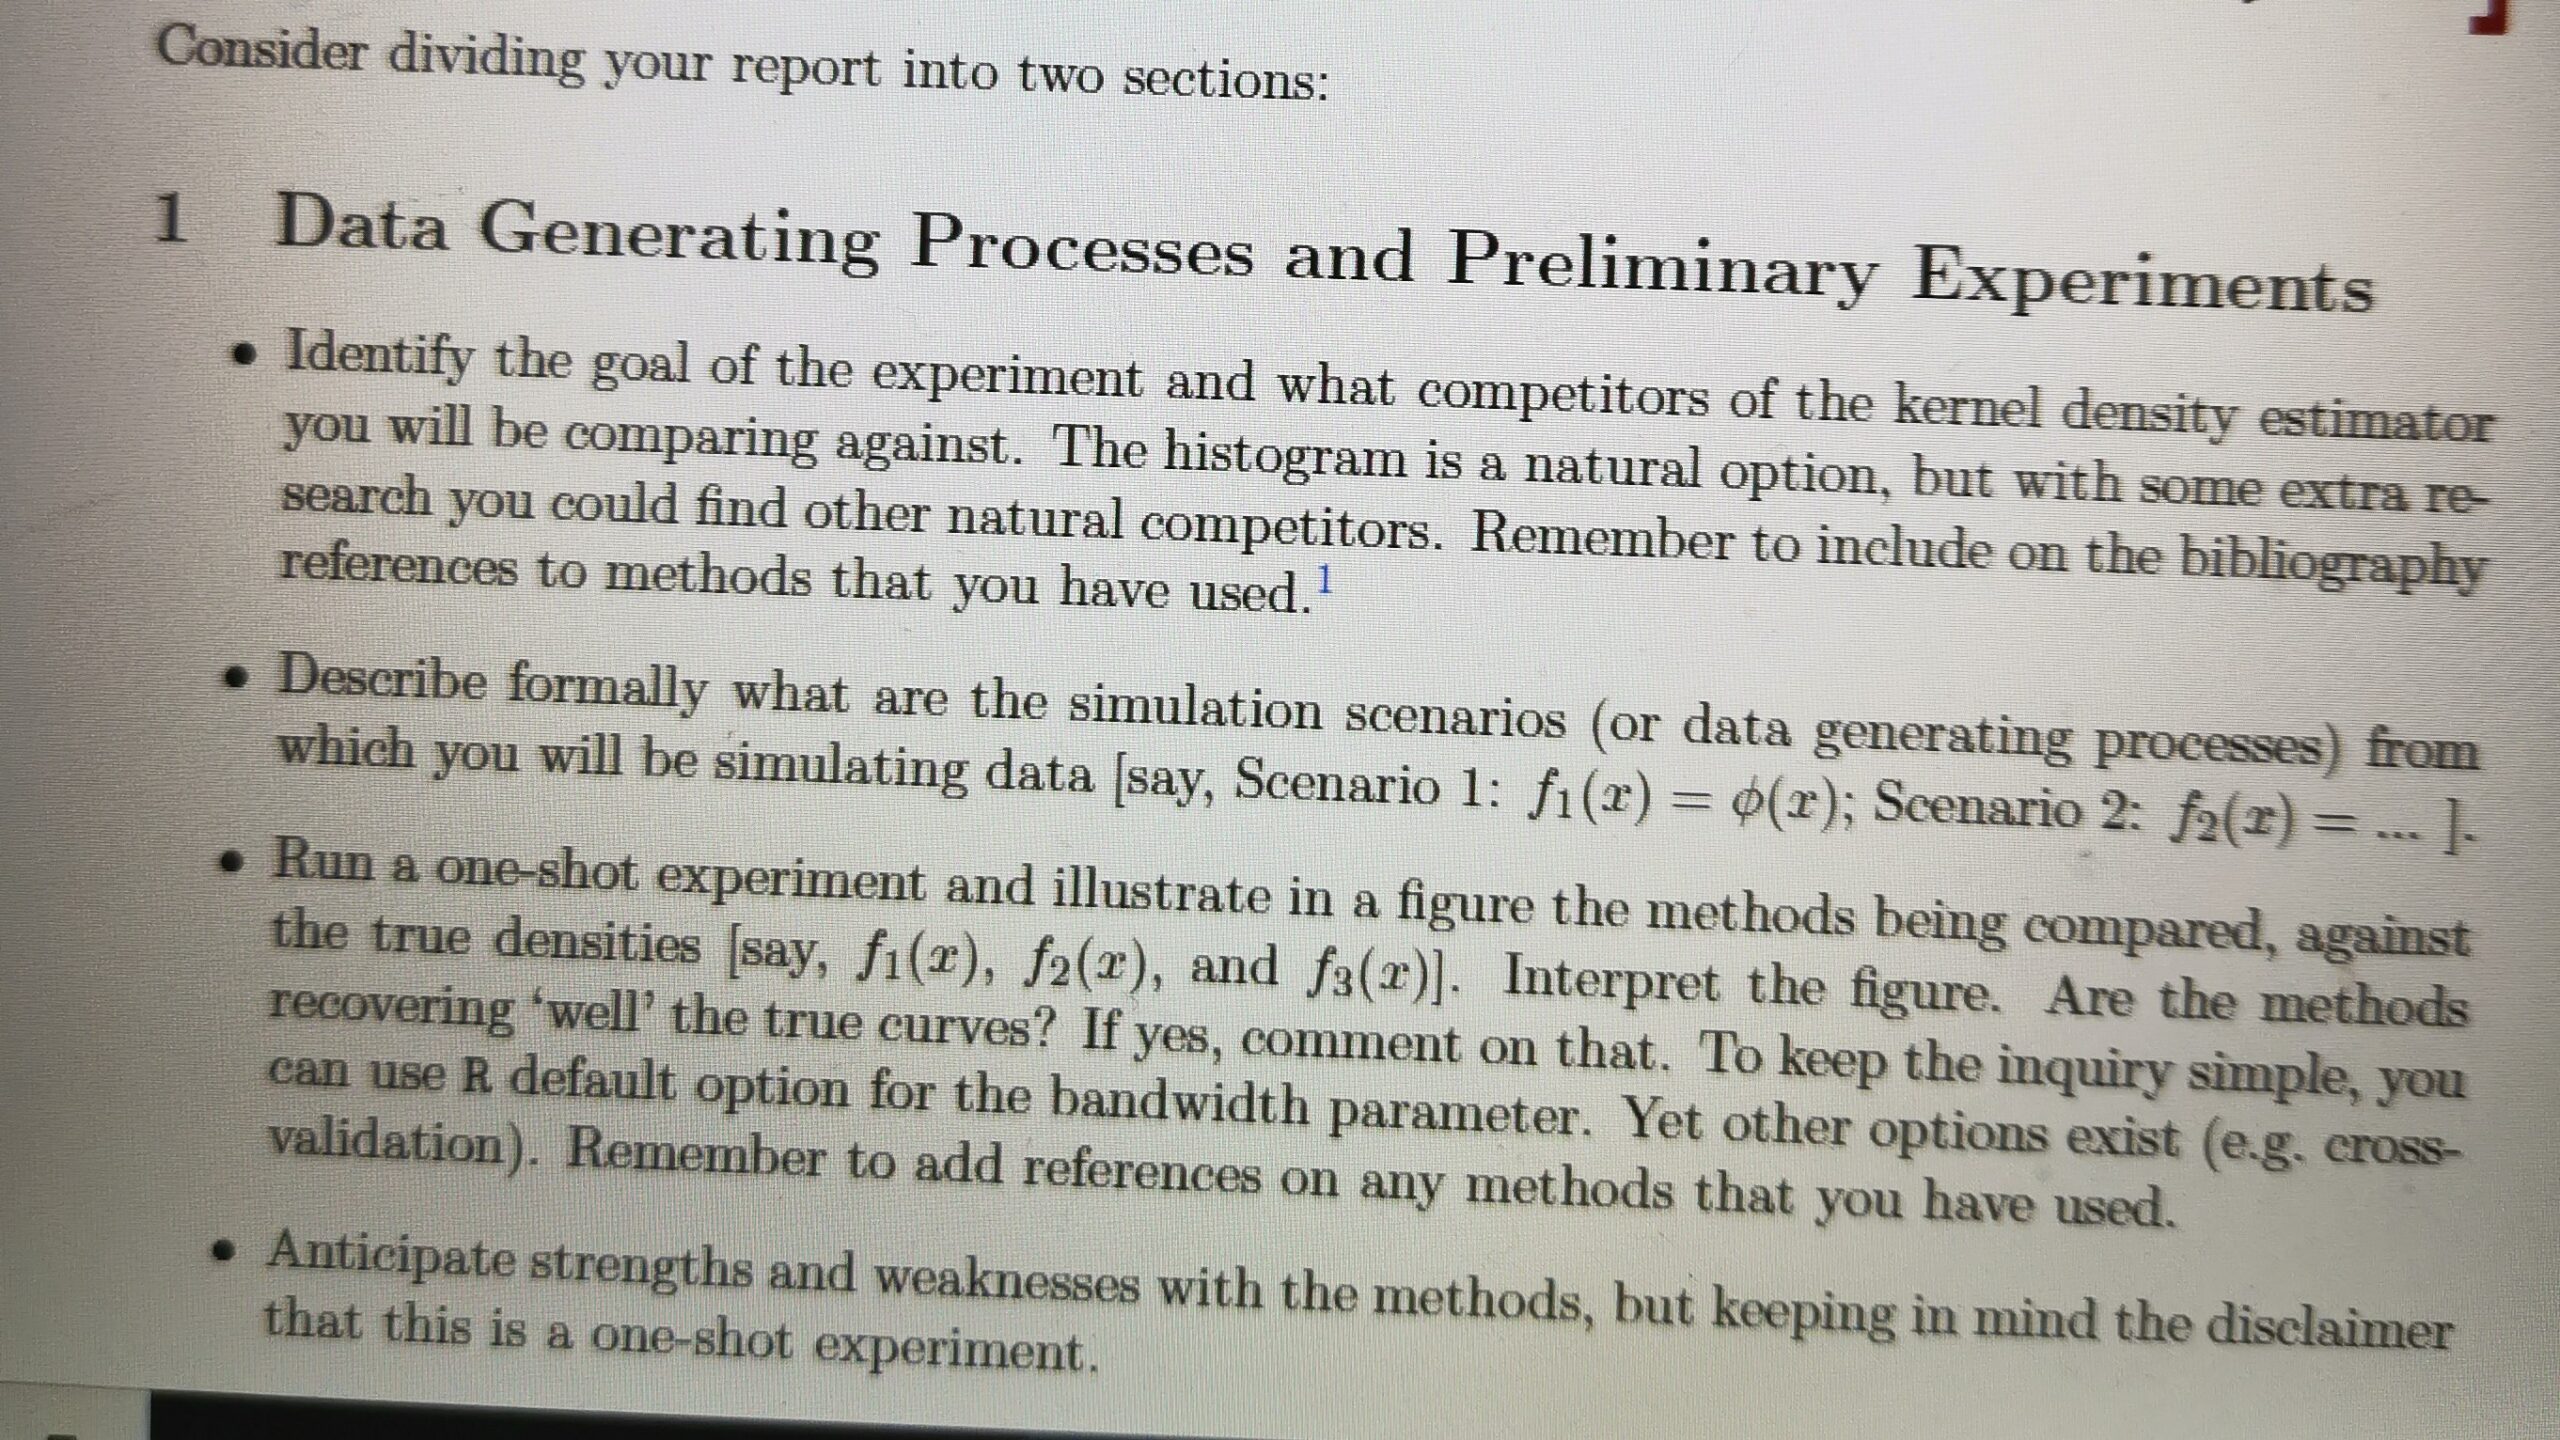
1 – Data Generation and Preliminary Experiments
Scenario 1 –
In this scenario, we have generated random values of data using rnorm function. We have created two functions data1 and data2, with different means and standard deviations. Then, we have combined both the data to increase the complexity parameter.
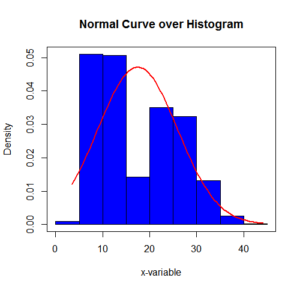
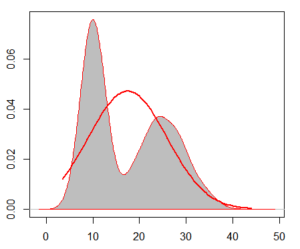
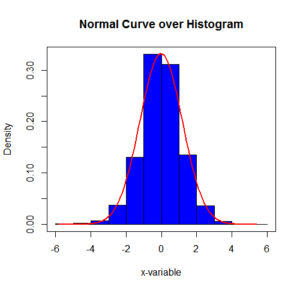
A histogram has been plotted (on the below left side) for the combined dataset, along with a normal curve on it. Density has been taken as the y-variable so that it would make things easier for comparing. It can be seen that there have been two spikes in the histogram with a dip in the middle. But, the normal curve has shown a single spike between the two spikes of histogram. Clearly, the normal curve is not properly representative of the dataset.
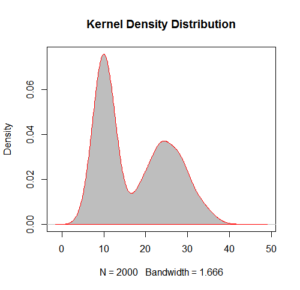
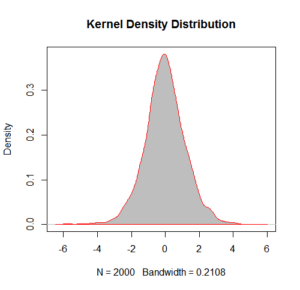
For the Kernel density distribution curve (right hand side of the upper curve), it can be seen that the curve has two spikes overall, as correctly visible for the quantitative data.
The difference between the two estimator is evident from the below given graph that Kernel density distribution is more accurate in understanding the patterns.
Scenario 2 –
In the second scenario, we have generated random values of data using rt function so that the data will have a t-distribution. Two datasets data3 and data4 have been created, but with different degrees of freedom, and then both the datasets have been combined together.
In the above two plots (Histogram and Kernel Density Distribution), we can see that the curves are looking more or less the similar in structure. For understanding the two curves more carefully, we would overlap the two structures, as shown in the figure below.
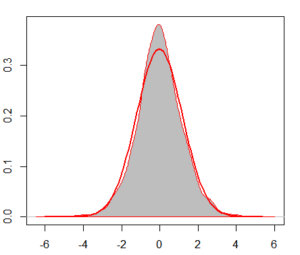
Here, we can see that the two curves almost overlap with each other, with only being some difference in the maximum density point for the two curves (Kernel Density having the higher one).
After these two scenarios taken, we can see that for the easier data distribution i.e. Scenario 2, both the curves are performing almost equal, but for a complex data distribution as in Scenario 1, the Kernel density estimation is performing better than the Histogram distribution with normal curve.
2 – Monte Carlo Simulation
In the Monte Carlo Simulation, we would be simulating data and understanding their patterns based on their varying sample sizes. It would also affect the distribution pattern of data.
Here, we are evaluating the performance of a standard t-test.
Null Hypothesis: Mean = 0
Alternate Hypothesis: Mean ≠ 0
In this study, we would be analyzing the changes in size and power of the test with varying sample sizes, distance from the null hypothesis, and standard deviation of the distribution.
Below is the LaTex code that have been generated for the simulation, which would be used for generating tables.
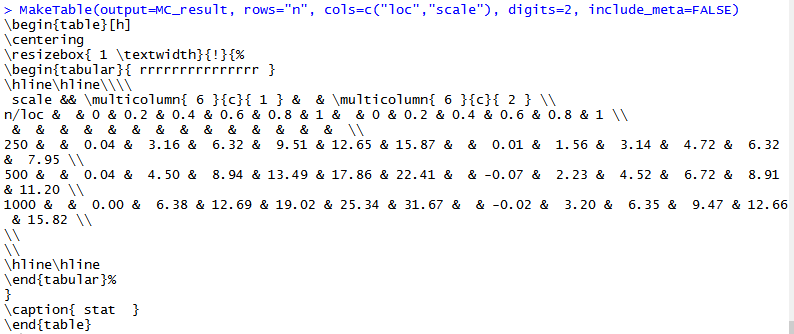
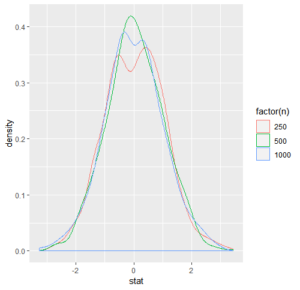
The below given figure highlights the changes in the distribution of data, according to varying sample sizes. It can be seen that the distribution is almost bimodal for sample size 250, and it becomes a proper normal distribution for sample size 500, but again it is tending to be bimodal for the sample size 1000. From this, we can conclude that the power and size of the distribution test has an optimal sample size for representing a normally distributed curve.
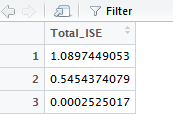
The Integrated Square Error has been calculated for the taken distribution of three sample sizes. It can be seen from the below table that the ISE values have reduced as the sample size has been increased. The lowest ISE (i.e. 0.0002525017) is for n=1000, then the second lower ISE (i.e. 0.5454374079) is for n=500, and then the highest value is for n=250
Looking for best Statistics Assignment Help. Whatsapp us at +16469488918 or chat with our chat representative showing on lower right corner or order from here. You can also take help from our Live Assignment helper for any exam or live assignment related assistance.