QUESTION
ANSWER
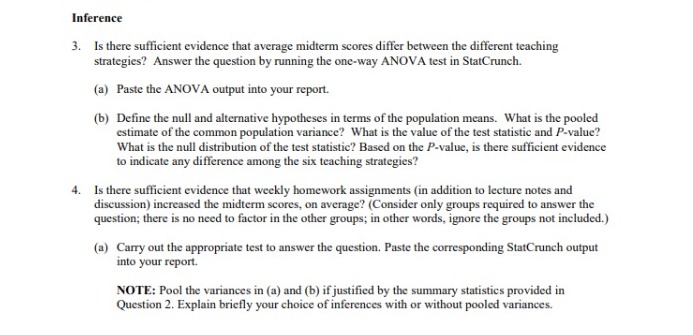
Study Design
1. Ans. The main aim of this study is to identify the most effective teaching strategy for teaching high school Mathematics to students. All high school Math students are the population of interest in this study. 120 students of the chosen high school are the subjects used in this study. Their mid term scores have been treated as the response variable. One independent variable has been taken in the study for analysis. The factor used in this study is the teaching strategy used for imparting Math education to students. There are six types of teaching strategies used, which tells us that there are six levels of factor used in the study, and those six types are C, H, Q, T, HT, and QT respectively.
The study design is this report is an experimental study, which is done to determine if there lies any difference in the achievement of students based on the different types of teaching methods that they have been provided. The achievement of students has been associated with the scores that they have got in their Math mid term exam. The inferential study in this case would be to rate teaching strategies on the basis of student scores. We would be comparing six levels of factor in this study. So, one way Anova test would be the most appropriate type of inferential statistics for this study. The causation would not be possible to infer in this study, because even though the scores of a student could be affected by the imparted teaching strategy but there could be several other factors affecting the scores such as no of hours studied, quantitative skills, etc. However, this study could help in finding the correlational factor for teaching methods and mid-term scores.
Exploratory Data Analysis
2. Ans. The descriptive statistics of the data has been given in the below table. Codes are symbolic of the type of teaching strategy, which are as follows – 1 stands for C, 2 for H, 3 for Q, 4 for T, 5 for HT, and 6 for QT. The data has been grouped by code, and the summary statistics have been calculated. The data has been equally distributed between the six codes.
|
Code |
n |
Mean |
Variance |
Std. dev. |
Std. Err. |
Median |
Range |
Min |
Max |
Q1 |
Q3 |
|
1 |
20 |
60.9 |
68.305263 |
8.2646998 |
1.8480431 |
62 |
29 |
45 |
74 |
53 |
67 |
|
2 |
20 |
78.5 |
48.368421 |
6.9547409 |
1.5551273 |
77.5 |
28 |
67 |
95 |
73.5 |
83.5 |
|
3 |
20 |
62.1 |
40.305263 |
6.3486426 |
1.4195996 |
62 |
25 |
51 |
76 |
57.5 |
65 |
|
4 |
20 |
68.9 |
87.252632 |
9.3409117 |
2.0886914 |
68 |
35 |
51 |
86 |
62 |
76.5 |
|
5 |
20 |
82.55 |
45.839474 |
6.7704855 |
1.5139266 |
82 |
25 |
70 |
95 |
78 |
85.5 |
|
6 |
20 |
69.8 |
94.8 |
9.7365292 |
2.1771541 |
67.5 |
35 |
55 |
90 |
63.5 |
74 |
From the above table, it can be observed that the mean of code 5 i.e. HT is greater than mean of all other groups by a considerable margin. The standard deviation for code 5 is also comparatively lesser, along with a lesser standard error. Code 1 has the lowest mean, but it shares the lowest median with code 3. But, the standard deviation of code 1 is greater than that of code 3. Code 6 has the highest standard deviation, while code 3 has the lowest. After comparing all the values, it appears that code 5 seems to be the best one, while code 1 seems to be the worst one. It appears that the assumption of equal variability is satisfied here as the difference between the standard deviation doesn’t seem to be a considerable one.
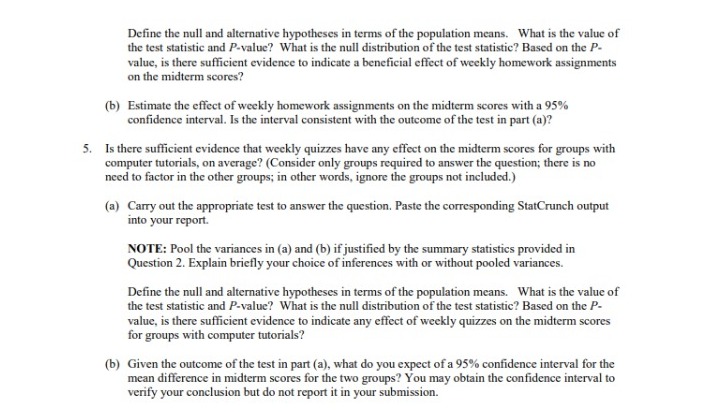
The above graph gives the boxplot distribution for all codes. It can be observed that code 6 appears to have an outlier. Apart from this, we can see that there is no extreme skewness in any of the six boxplots drawn for the teaching strategies. Hence, we can confirm that ANOVA assumptions are not violated as far as normality is concerned. If we look at the shapes of the boxplots, we can see that code 5 appears to be most normally distributed out of all, code 3 and code 1 are left skewed, whereas code 2, 4, and 6 are right skewed. Code 6 appears to be the most skewed, with the presence of an outlier, whereas code 3 is less skewed than other 4 codes apart from 5. The centers for code 2 and code 5 are on the higher side, while code 1 and code 3 have their centers on the lesser side.
Given the above results of boxplot and descriptive statistics, we can see that the assumptions of normality and variance equality hold true in this study, and hence, the ANOVA F-test is valid in this case, the result of which we would observe in further parts of the report.
Inference
3. Ans. ANOVA –
One way ANOVA F test is performed for testing the difference in scores for the teaching strategies, the output of which has been shown below.
Analysis of Variance results:
Responses: Score
Factors: Code
Response statistics by factor
|
Code |
n |
Mean |
Std. Dev. |
Std. Error |
|
1 |
20 |
60.9 |
8.2646998 |
1.8480431 |
|
2 |
20 |
78.5 |
6.9547409 |
1.5551273 |
|
3 |
20 |
62.1 |
6.3486426 |
1.4195996 |
|
4 |
20 |
68.9 |
9.3409117 |
2.0886914 |
|
5 |
20 |
82.55 |
6.7704855 |
1.5139266 |
|
6 |
20 |
69.8 |
9.7365292 |
2.1771541 |
ANOVA table
|
Source |
DF |
SS |
MS |
F-Stat |
P-value |
|
Code |
5 |
7499.2417 |
1499.8483 |
23.382091 |
<0.0001 |
|
Error |
114 |
7312.55 |
64.145175 |
||
|
Total |
119 |
14811.792 |
Levene’s Test for Homogeneity of Variance
|
Test Statistic |
DF 1 |
DF 2 |
P-value |
|
1.4704927 |
5 |
114 |
0.2049 |
For the interpretation of above ANOVA output, we would start first with Levene’s test for homogeneity of variance. Though we have already validated the equal variance assumption, we will validate it again using Levene’s Test. The null hypothesis for this test is there is equality of variance between the six groups. The alternate hypothesis will be that at least any two group violate the homogeneity of variance. We can see that the p-value of this test is 0.2049, which is greater than our acceptable limit of 0.05. Hence, we fail to reject the null hypothesis and homogeneity of variance assumption is not violated in this study. Levene’s Test statistic comes out to be 1.4705.
Now, we would like to interpret the ANOVA table. The hypotheses for this ANOVA test are as follows:
H0: The mean scores of all the six groups are equal (i.e. The mean scores of students exposed to each of the six teaching strategies are equal.)
HA: At least one of the mean scores out of the six groups is different. (i.e. At least one teaching strategy students have obtained different mean scores.)
ANOVA table gives all the important values required for this test. The pooled estimate of the common population variance comes out to be 64.1452.The value of F-test statistic is 23.3821 and the p-value is <0.0001, which is clearly very lesser than our acceptable limit. For the given degrees of freedom, the critical value of F-statistic comes out to be 2.2939.
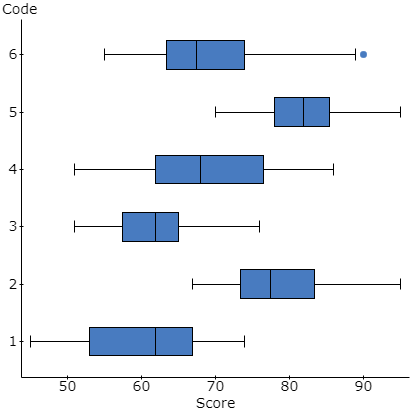
The F distribution graph has also been drawn above and we can see that the probability is very less for the test statistic. After looking at all the values, we can see that our F statistic value is greater than our F critical value, and p-value is lesser than the significance level. Hence, we will reject the null hypothesis. Thus, we can say that at least one of the mean scores of the six groups is different, or in other way, at least one of the teaching strategy students have different mean scores. There is enough evidence to indicate a difference among the six teaching strategies.
4. Ans. We are talking about the effectiveness of weekly homework assignments for those students who have already been provided lecture notes and discussions. We want to compare the mean difference between the C group student scores and H group student scores and see if there is any improvement due to addition of weekly homework assignments for students. Therefore, we would be performing two sample T-test here.
Two sample T hypothesis test:
μ1 : Mean of Score_H
μ2 : Mean of Score_C
μ1 – μ2 : Difference between two means
H0 : μ1 – μ2 = 0 (There is no difference between the two means.)
HA : μ1 – μ2 ≠ 0 (There is a significant difference between the two means.)
(with pooled variances)
Hypothesis test results:
|
Difference |
Sample Diff. |
Std. Err. |
DF |
T-Stat |
P-value |
|
μ1 – μ2 |
17.6 |
2.4153021 |
38 |
7.2868732 |
<0.0001 |
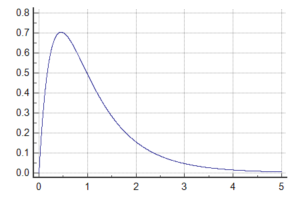
We can see the output of the performed test here. The value of t-statistic comes out to be 7.2869 and the p-value is <0.0001, which is well within our acceptable limit. We can see the null distribution of the test statistic below. For the given degrees of freedom and significance level of 0.05, the critical value of t-statistic is 1.686. From these results, we can observe that t-statistic value is greater than the t-critical value, and p-value is lesser than the significance level. Hence, we reject the null hypothesis. Thus, we can say that there is a significant difference between the two means. Elaborating this point, we can see that mean score of H strategy students is higher than the mean score of C strategy students. There is enough evidence to say that there is a beneficial effect of weekly homework assignments on the midterm scores.
Two sample T confidence interval:
μ1 : Mean of Score_H
μ2 : Mean of Score_C
μ1 – μ2 : Difference between two means
(with pooled variances)
95% confidence interval results:
|
Difference |
Sample Diff. |
Std. Err. |
DF |
L. Limit |
U. Limit |
|
μ1 – μ2 |
17.6 |
2.4153021 |
38 |
12.710477 |
22.489523 |
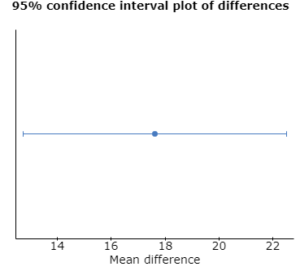
From the above Confidence Interval output, we can see that the confidence interval of 95% for the difference in two means ranges from 12.7105 as the lower limit to 22.4895 as the upper limit. The interval seems to be consistent with the outcome of the earlier test. The sample mean difference is 17.6.
5. Ans. We are talking about the effectiveness of weekly quizzes for those students who have already been provided computer tutorials. We want to compare the mean difference between the T group student scores and QT group student scores and see if there is any improvement due to addition of weekly quizzes for computer tutorials students. Therefore, we would be performing two sample T-test here.
Two sample T hypothesis test:
μ1 : Mean of Score_QT
μ2 : Mean of Score_T
μ1 – μ2 : Difference between two means
H0 : μ1 – μ2 = 0 (There is no difference between the two means.)
HA : μ1 – μ2 ≠ 0 (There is a significant difference between the two means.)
(with pooled variances)
Hypothesis test results:
|
Difference |
Sample Diff. |
Std. Err. |
DF |
T-Stat |
P-value |
|
μ1 – μ2 |
0.9 |
3.0170568 |
38 |
0.29830397 |
0.7671 |
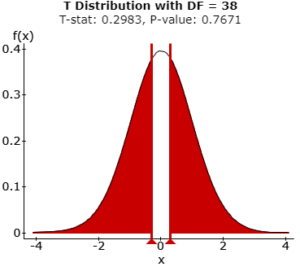
We can see the output of the test above. The value of t-statistic here comes out to be 0.2983 and the p-value is 0.7671, which is higher than our acceptable limit. For the given values of degrees of freedom and 0.05 as the significance level, the critical t value comes out to be 1.686. The value of t-statistic from the performed test is lesser than the critical t value, which can be seen from the above null distribution of the test statistic. After analyzing the test statistic value and p-value and comparing it with t critical value and significance level, we can say that we fail to reject the null hypothesis. Thus, we can say that there is no significant difference between the two means i.e. there is no significant improvement due to addition of quizzes for students with computer tutorials. The mean score QT strategy students is not significantly higher than that of T strategy students. Based on these values, there is not enough evidence to indicate any effect of weekly quizzes on the midterm scores for groups with computer tutorials.
Two sample T confidence interval:
μ1 : Mean of Score_QT
μ2 : Mean of Score_T
μ1 – μ2 : Difference between two means
(with pooled variances)
95% confidence interval results:
|
Difference |
Sample Diff. |
Std. Err. |
DF |
L. Limit |
U. Limit |
|
μ1 – μ2 |
0.9 |
3.0170568 |
38 |
-5.2077121 |
7.0077121 |
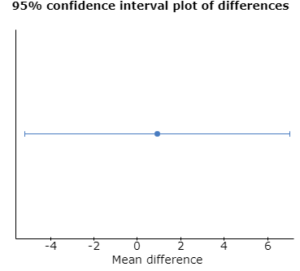
The sample mean difference is 0.9. From the above Confidence Interval output, we can see that the confidence interval of 95% for the difference in two means ranges from -5.2077 as the lower limit to 7.0077 as the upper limit. The interval seems to be consistent with the outcome of the earlier test. We can see that 0 lies in the range of 95% confidence interval.
Looking for best Statistics Assignment Help. Whatsapp us at +16469488918 or chat with our chat representative showing on lower right corner or order from here. You can also take help from our Live Assignment helper for any exam or live assignment related assistance