QUESTION

ANSWER
HYPOTHESIS TESTING
We have a dataset. We want to test the claim that the mean BMI of men is equal to women.( μ1= Mean BMI of female, μ2= Mean BMI of male)
We assume that the 2 samples are independent simple random samples selected from normally distributed populations. We don’t assume the population standard deviations are equal.
The test procedure, called the two-sample t-test, is appropriate when the following conditions are met:
- The sampling method for each sample is simple random sampling.
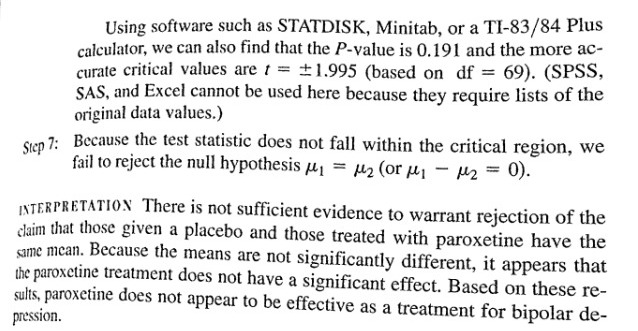
- The samples are independent.
- The sampling distribution is approximately normal.
- The sample size is greater than 40, without outliers.
We checked for outliers. The female dataset has 1-2 outliers and male dataset has 3-4 outliers. Since they are deviating slightly we have ignored the values. As sample size is large we proceed with a formal hypothesis test.
State the Hypotheses
Every hypothesis test requires the analyst to state a null hypothesis and an alternative hypothesis. The hypotheses are stated in such a way that they are mutually exclusive. That is, if one is true, the other must be false; and vice versa.
The table below shows three sets of null and alternative hypotheses. Each makes a statement about the difference d between the mean of one population μ1 and the mean of another population μ2. (In the table, the symbol ≠ means ” not equal to “.)
|
Set |
Null hypothesis |
Alternative hypothesis |
Number of tails |
|
1 |
μ1 – μ2 = d |
μ1 – μ2 ≠ d |
2 |
|
2 |
μ1 – μ2 > d |
μ1 – μ2 < d |
1 |
|
3 |
μ1 – μ2 < d |
μ1 – μ2 > d |
1 |
The first set of hypotheses (Set 1) is an example of a two-tailed test, since an extreme value on either side of the sampling distribution would cause a researcher to reject the null hypothesis. The other two sets of hypotheses (Sets 2 and 3) are one-tailed tests, since an extreme value on only one side of the sampling distribution would cause a researcher to reject the null hypothesis.
When the null hypothesis states that there is no difference between the two population means (i.e., d = 0), the null and alternative hypothesis are often stated in the following form.
Ho: μ1 = μ2
Ha: μ1 ≠ μ2
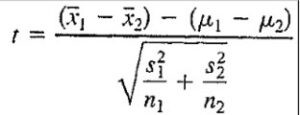
We will use as given in set 1. Because we have 2 independent samples and we are testing a claim about the 2 population means we use a t distribution with the following test statistic:

Since sample sizes are large we use normal approximation, instead of t we will have z in the above formula which will follow a N(0,1) distribution instead of t distribution.
Conclusion:
Since z value is 1.963146>1.96(significance value at 5%) null hypothesis may be rejected at 5% level of significance and we may conclude there is significant difference between sample means. So mean BMI of women is different from men.
NOTE: The test is a 2 sample t test only since the sample size is (147 and 153) we cannot apply the 2 sample t test.We will instead use a normal approximation (and compare Z value with significance value at 5% level of significance).Calculated value of z statistic is correct.no need to recalculate. Have done entire experiment in excel.
As p value is 0.058081,this means that if the average BMI of all men are the same as average BMI of all women,the chance of getting this high a z score in a sample is only 0.058 or 5.8%.
Looking for Statistics Assignment Help. Whatsapp us at +16469488918 or chat with our chat representative showing on lower right corner or order from here. You can also take help from our Live Assignment helper for any exam or live assignment related assistance.