QUESTION
Part 1: Presenting, Analyzing and Interpreting Management
You are the junior analyst of a firm which wants to invest in a company that in addition to high financial performance is also socially and environmentally responsible.
1) Your manager has given you the list of 50 best financial performing companies and their respected social and environmental performance scores for 2014 and 2015 with the following instructions (related data on Moodle):
a) Find the companies in the Upper Quartile for 2014
b) Find the companies in the Upper Quartile for 2015
c) Separate companies that appear in both of the above lists
d) Compare your findings for both years using a table and comparable graph to visually demonstrate your results.
2) Considering the results you have shown your manager, they now want to know (out of the companies you have shortlisted) the following:
a) The social and environmental performance growth of the companies
b) Which company has made the best improvement in their social and environmental performance from 2014 to 2015
c) Has any company demonstrated a decline in its social and environmental growth in the two years?
d) Considering all the information you have collected what would your suggestion be to your manager? Is the data and information gained from it sufficient to choose a company to invest in? If you decide the data provided is not sufficient, what other data would you suggest collecting to enhance the current data?
Hint for questions 1 and 2: To impress your manager remember where possible show your calculations and display your results clearly in a table/graph in the most appropriate manner.
IBDM For Part 1-Question 1 and 2
2014
| Company Name | Social and Environmental Performance Score |
| Company 1 | 57.34 |
| Company 2 | 49.96 |
| Company 3 | 30.55 |
| Company 4 | 49.61 |
| Company 5 | 59.75 |
| Company 6 | 56.81 |
| Company 7 | 54.22 |
| Company 8 | 56.67 |
| Company 9 | 56.71 |
| Company 10 | 61.06 |
| Company 11 | 48.82 |
| Company 12 | 62.66 |
| Company 13 | 46.30 |
| Company 14 | 54.12 |
| Company 15 | 36.19 |
| Company 16 | 53.52 |
| Company 17 | 61.46 |
| Company 18 | 58.32 |
| Company 19 | 48.82 |
| Company 20 | 55.08 |
| Company 21 | 50.63 |
| Company 22 | 57.57 |
| Company 23 | 57.34 |
| Company 24 | 60.03 |
| Company 25 | 51.74 |
| Company 26 | 58.77 |
| Company 27 | 58.39 |
| Company 28 | 55.65 |
| Company 29 | 53.31 |
| Company 30 | 58.85 |
| Company 31 | 50.70 |
| Company 32 | 56.07 |
| Company 33 | 53.93 |
| Company 34 | 55.60 |
| Company 35 | 52.19 |
| Company 36 | 56.34 |
| Company 37 | 61.14 |
| Company 38 | 47.42 |
| Company 39 | 58.58 |
| Company 40 | 56.56 |
| Company 41 | 64.57 |
| Company 42 | 49.73 |
| Company 43 | 64.04 |
| Company 44 | 48.25 |
| Company 45 | 52.24 |
| Company 46 | 60.10 |
| Company 47 | 55.66 |
| Company 48 | 47.56 |
| Company 49 | 65.46 |
| Company 50 | 61.18 |
2015
| Company Name | Social and Environmental Performance Score |
| company 1 | 44.39 |
| company 2 | 52.75 |
| company 3 | 32.05 |
| company 4 | 49.94 |
| company 5 | 62.56 |
| company 6 | 63.05 |
| company 7 | 56.52 |
| company 8 | 59.95 |
| company 9 | 58.07 |
| company 10 | 63.14 |
| company 11 | 49.48 |
| company 12 | 61.51 |
| company 13 | 47.78 |
| company 14 | 50.51 |
| company 15 | 44.76 |
| company 16 | 53.38 |
| company 17 | 58.44 |
| company 18 | 59.30 |
| company 19 | 43.75 |
| company 20 | 48.54 |
| company 21 | 46.58 |
| company 22 | 61.95 |
| company 23 | 54.44 |
| company 24 | 56.13 |
| company 25 | 53.54 |
| company 26 | 59.41 |
| company 27 | 57.52 |
| company 28 | 58.55 |
| company 29 | 48.97 |
| company 30 | 61.01 |
| company 31 | 53.17 |
| company 32 | 50.01 |
| company 33 | 54.84 |
| company 34 | 53.91 |
| company 35 | 54.64 |
| company 36 | 53.26 |
| company 37 | 61.47 |
| company 38 | 60.25 |
| company 39 | 59.70 |
| company 40 | 54.08 |
| company 41 | 65.29 |
| company 42 | 50.28 |
| company 43 | 64.88 |
| company 44 | 45.31 |
| company 45 | 50.07 |
| company 46 | 60.58 |
| company 47 | 52.04 |
| company 48 | 47.74 |
| company 49 | 66.16 |
| company 50 | 60.17 |
3) A big company has 50 outlets around the country. Each outlet spends a certain amount of money on advertising. The company would like to know if there is any relationship between the cost of advertisements and the revenue generated by the outlet. Use a graph to visually explore this relationship to see whether it exists and if so, is it positive or negative? What else does the graph show? Write a short report to explain your findings to the company (10 points, no more than 100 words, related data is on Moodle
| Advertisement | Revenue Generated |
| £975,044 | £1,437,854.75 |
| £74,110 | £93,509.73 |
| £892,822 | £1,343,686.19 |
| £336,378 | £516,438.85 |
| £669,873 | £1,027,242.09 |
| £565,855 | £784,154.56 |
| £622,036 | £26,937.77 |
| £515,179 | £642,157.40 |
| £341,647 | £659,198.39 |
| £282,347 | £454,998.01 |
| £764,539 | £1,261,380.09 |
| £672,447 | £813,791.07 |
| £407,628 | £706,992.73 |
| £714,673 | £752,989.20 |
| £721,731 | £1,122,301.22 |
| £65,999 | £72,192.02 |
| £822,846 | £1,362,695.24 |
| £691,615 | £1,189,006.74 |
| £279,556 | £551,129.02 |
| £53,402 | £86,100.34 |
| £187,465 | £348,104.52 |
| £46,928 | £81,456.85 |
| £771,102 | £1,029,503.94 |
| £972,475 | £1,034,606.93 |
| £498,493 | £762,648.30 |
| £405,148 | £483,554.31 |
| £109,180 | £207,616.85 |
| £742,827 | £926,473.20 |
| £410,456 | £595,224.42 |
| £958,631 | £1,346,288.02 |
| £822,630 | £1,284,574.57 |
| £871,324 | £1,357,879.44 |
| £500,061 | £790,429.28 |
| £556,609 | £810,394.81 |
| £422,837 | £822,827.89 |
| £88,063 | £97,349.13 |
| £251,294 | £382,829.28 |
| £767,537 | £1,464,111.25 |
| £883,356 | £999,962.59 |
| £781,432 | £1,291,165.37 |
| £543,488 | £611,796.94 |
| £857,478 | £1,254,891.77 |
| £91,361 | £131,143.28 |
| £772,424 | £786,422.77 |
| £932,051 | £1,488,550.03 |
| £325,260 | £405,714.22 |
| £312,971 | £530,738.86 |
| £729,147 | £1,129,876.35 |
| £775,308 | £949,727.82 |
Part 2: Probability and Uncertainty
1. A large supermarket produces its own store brand hand cream. Last year the machines used to produce the cream were refurbished. Since then the supermarket has been receiving a lot of complaints from unhappy customers that there is not enough cream in the container. The machine is calibrated for 100ml with a standard deviation of 5ml. The label on the cream says there is minimum of 98ml.
a) What is the probability that there will be less cream in the container than specified on the label? Considering your calculations, is there cause for concern?
b) The management has decided to change the labels on the hand cream and requires no more than 5% of containers to be under the advertised contents. What should be printed on the label as minimum amount? (3 points)
c) If you were advising the supermarket, what would you advise them to do? What should the company consider? What data would they need?
2. A medical researcher has found that in a group of 60 employees who use the samecanteen (cafeteria) in their offices, only 20 are healthy and every other person has either high blood pressure, high level of cholesterol or both. If 20 people have high blood pressure and 35 have high level of cholesterol.
a) How many people have only high blood pressure?
b) How many people have only high level of cholesterol?
c) How many people with high blood pressure have high level of cholesterol too?
d) If a person is selected randomly from this group, what is the probability that he/she Is healthy?
e) Has high blood pressure, given that they have high level of cholesterol?
f) Has high level of cholesterol given that they do not have high level of blood pressure?
g) If you were the medical researcher, what would you advise the company in regard to the food served at the cafeteria? Does it seem to be health?
3. A rental shop in a ski resort is preparing for the skiing season. In previous years on a common day during the season 40% of their VIP customers would prefer to rent the latest snowboard and 60% would prefer skis. The rental shop have 6 snowboards and 9 skis. Considering that in total 10 VIP customers have booked cabins on the resort.
a) What is the probability that half of the VIP customers will rent the newest snowboard?
b) What is the probability that in a common day during the season there will be more demand for snowboard than what they are deciding to buy? (3 points)
Part 3: Financial Decision Making
1. You are thinking of investing £2000. You have found the following investment deals which seem good
The first one pays 4.50% annual interest compounded annually.
The second one pays 4.48% annual interest but compounded quarterly
The third one pays 4.45% annual interest but compounded monthly
a) Which one would be in your benefit to choose? How much money will you have after 3 years?
b) Considering the above, explain how using both nominal and effective interest rates make financial decisions easier.
2. Your company needs a new machine. Two companies are selling this machine in the market, their conditions are as below
Company A: The purchase of the new machine at a cost of £15,000. The purchase price includes maintenance for the first two years, but after that maintenance will cost £1,050 a year (payable at the end of each year).
The machine will have a useful life of five years, after which time it is estimated that it will have a scrap value of £4,000.
The expected income from the machine will be £1,500 at the end of the first year, £2,500 end of the second year, £3,500 end of the third year, £4,500 at the end of the fourth year, and £5,500 at the end of the fifth year.
Company B: The purchase of the new machine at a cost of £10,000. The purchase price includes maintenance for the first year, but after that maintenance will cost £1,000 a year (payable at the beginning of each year).
The machine will have a useful life of five years, after which time it is estimated that it will have a scrap value of £1,500.
The expected income from the machine will be £1000 at the end of the first year, £3000 each year at the end of the second, third and fourth years, and £5000 at the end of the fifth year. Assuming the discount rate is 4%, write a brief report advising the company on which
contract will be more profitable and so whether it should accepted. Remember to take all costs and cash availability into consideration. Show any calculations you make in support of your recommendation.
3. How confident are you about your advice and under what circumstances might it
change?
ANSWER
Part 1 – Presenting, Analysing, and Interpreting management
1. Sol. (a) Total no of observations is 50. We will first sort the data in ascending order of Social and Environmental Performance Score.
Formula for upper quartile is: Q3 = ¾ of (n+1)th term = 3*51/4th term = 38.25th term
So, the companies from 39th to 50th term will come in the upper quartile range, which are –
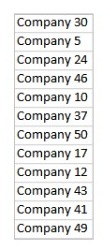
(b) Sol. Similarly, for the year 2015 also, the company ranking from 39th to 50th, when sorted in the ascending order of Performance Score, will come in the upper quartile range, which are as follows:
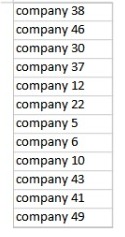
(c) Sol. Companies that appear in both the lists are – 46, 30, 37, 12, 5, 10, 43, 41, 49.
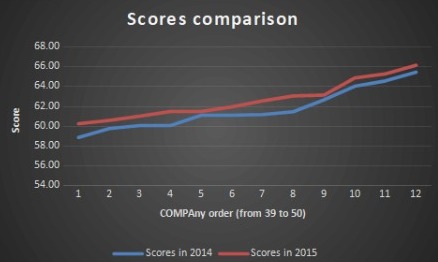
(d) Sol. It can be seen that the scores have overall increased in the year 2015 as compared to year 2014. In the below given figure, it can be observed that the red line has always remained above the blue line in terms of value for the same position in the dataset for 2 years. Moreover, the top 3 positions in the ascending order have been constantly taken by company 43, company 41, and company 49 respectively.
2. (a) Ans. The below given gives the performance score of the companies in the ascending order for both the years.
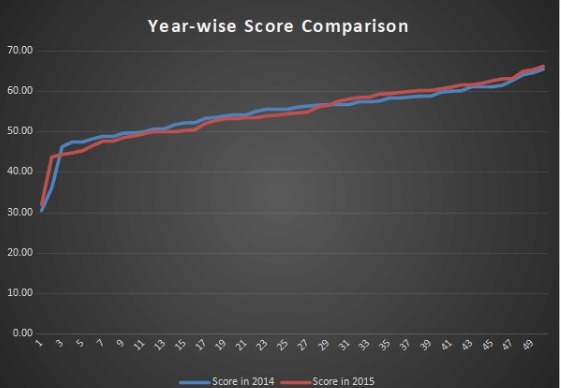
It can be observed from the above figure that for the same position in the order, blue line is above than the red line for the first half of the datasets i.e. Scores in 2014 are higher for the lower half companies as compared to the scores in 2015. However, after a certain data point i.e. from 29th position, red line is above the blue line. Scores in 2015 are higher than scores in 2014 for the upper half side of the data. Hence, we can say that the poor performing companies even got worse in 2015, whereas the better performing companies got more better in 2015 in terms of score.
(b) Ans. Company 38 has made the best improvement in their social and environmental performance from 2014 to 2015.
(c) Ans. There are total 20 companies who have demonstrated a decline in its social and environmental growth in the two years.
(d) Ans. Considering all the given information, we would not be able to choose a company for investment as data is only about their Social & Environmental Performance Score for a duration of 2 years, which is certainly not enough to find out any pattern in the existing data.
Since this data is not sufficient, we are going to need other data for choosing company to invest. I would suggest having the score for last 10 years for finding any pattern in the data. The number of intact societies with the company, Number of environmental programmes per year will be required.
3. Ans. We would like to build a scatterplot graph between the advertisement spend and revenue generated for finding out the relationship between the two variables. From the below figure, we can observe that there is a positive correlation between the two variables with an upward slope. There is a dip in between the dataset, where the advertisement spend is lower and revenue generated is higher.

Moreover, we can see that there is a seasonality factor in both the datasets, due to which every spike is followed by a crust.
Part 2 – Probability and Uncertainty
1. (a) Sol. Given, μ = 100 ml, σ = 5 ml.
The given value for check is x = 98 ml.
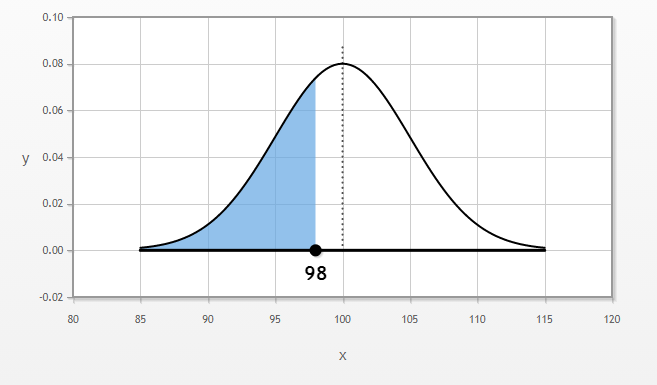
P (X < 98) = {P (X – μ) < 98 – 100} = [P{(X-µ)/σ < (98-100)/5}]
Z value comes out to be – 0.4. Using the standard normal table,
P (Z < −0.4) =0.3446
There is a 34.46% probability that there will be less cream in the container than specified on the label.
There is a cause for concern, as the probability of defect is too large, and every one out of three customers will get dissatisfied customers.
(b) Sol. No more than 5% of containers are required to be under the advertised contents.
So, the probability of defect will be less than or equal to 0.05.
For a left-tailed distribution, Z Score for p being equal to 0.05 is – 1.64.
Now, Z Score = (X-µ)/σ, which implies that
-1.64 = (X-100)/5 => -8.2 = X – 100 => X = 100 – 8.2 = 91.8
Thus, the printed minimum amount on the label should be 91.8 ml.
(c) sol. The supermarket should try to promise customers within a 95% tolerance limit to reduce the number of unhappy customers. If we right the label as 92 ml, we will be dealing with a probability of around 5-6% for having lesser cream.
The supermarket has only two options as of now – first is to purchase the cream producing machine which could give better calibration, which could increase the raw material cost for the supermarket, and second is to reduce the label content and print only what the machine is capable to produce. The latter seems to be a viable option, as it will help in explaining the quality to customers before purchasing, and hence, they will be knowing the quality at the time of purchase. The expectation of cream content for customers would be a helpful data for the supermarket.
2. Sol. Total no of employees = 60
No of healthy person = 20
No of unhealthy person (A U B) = 40
No of people with high blood pressure (A) = 20
No of people with high level of cholesterol (B) = 35
Let the no of people with both high blood pressure and high level of cholesterol (A ∩ B) be x.
Now, we know that for two sets,
(A U B) = A + B – (A ∩ B)
So, 40 = 20 + 35 – x
- x = 55 – 40 = 15
(a) Ans. People with only high blood pressure = A – (A ∩ B) = 20 – 15 = 5
(b) Ans. People with only high level of cholesterol = B – (A ∩ B) = 35 – 15 = 20
(c) Ans. People with both high blood pressure and high level of cholesterol = (A ∩ B) = 15
(d) Ans. Probability of a person selected randomly being healthy = No of healthy person/Total no of employees = 20/60 = 0.33
(e) Ans. Probability of a person having high blood pressure, given that they have a high level of cholesterol = P(A | B) = P(A ∩ B)/P(B) = (15/60)/(35/60) = 15/35 = 0.43
(f) Ans. Probability of a person having high level of cholesterol, given that they do not have high level of blood pressure = P(B | ) = P(B ∩ )/P()
P() = 1 – P(A) = 1 – (20/60) = 1 – 0.33 = 0.67
P(B ∩ ) = 20/60 = 0.33
Hence, the required probability, P(B | ) = 0.33/0.67 = 0.5
(g) Ans. If I were the medical researcher, I would advise the company to focus on the quality of food served at the cafeteria and improve the quality as soon as possible because it doesn’t seem to be healthy. Only 1/3rd of the employees are healthy at present. Rest of them are either suffering from high blood pressure, high level of cholesterol or both. The company needs to reduce the unhealthy people, and for that, it needs to improve the quality of food served in the cafeteria.
3. Ans. Given, On a common day during the season,
Percentage of VIP customers preferring to rent the latest snowboard = 40%
Percentage of VIP customers preferring to rent the skis = 60%
The rental shop has 6 snowboards and 9 skis.
Probability of a latest snowboard being rented by a VIP customer = 0.4
Probability of a ski being rented by a VIP customer = 0.6
(a) Ans. Probability for half of the VIP customers renting the newest snowboard = C1O5*0.45 * 0.65
= 252 * 0.01024 * 0.07776 = 0.200658
(b) Ans. Probability that in a common day during the season there will be more demand for snowboard than what they are deciding to buy = C1O7*0.47 * 0.63 + C1O8*0.48 * 0.62 + C1O9*0.49 * 0.61 + C1O10*0.410 * 0.60 = 0.054762.
Part 3 – Financial Decision Making
1. Ans. (a) Option 2 of 4.48% annual interest rate compounded quarterly gives the highest return value.
We will be having £2286 as total amount after 3 years.
(b) Ans. Nominal Interest rate for the three cases are 4.5%, 4.48%, and 4.45% respectively, but with different compounding period. But, the effective interest rate has been the main deciding factor here, as the nominal interest rates are not comparable in this case since the compounding for the three cases are not the same. Thus, effective interest rates have been calculated for rectifying this issue by converting nominal rates into annual compound interest.
Effective Interest Rate can be calculated as
ie = (1 + Nominal Rate/No of compounding periods per year)Total no of compounding periods – 1
2. Ans. The discount rate has been given as 4%.
Machine cost from company A = £15000
Machine cost from company B = £10000
Scrap value for machine from company A = £4000
Scrap value for machine from company B = £1500
The calculations have been done in the Excel sheet.
After considering all costs and cash availability into consideration, purchasing machine from company B is more profitable than purchasing from company A. The Net Present Value for purchasing from company A comes out to be £672.74, while for company B is £1,500.00.
Hence, we should purchase the machine from company B.
3. Ans. We are confident about our advice, and the Net present values have been calculated taking all parameters into account. However, it can change if the cost price of machine A gets reduced to less than £14140, keeping all other values the same. Then, in that case, the Net Present Value for the machine A will be higher than that of B. It can also change in the case of Scrap value of machine being equal to 5090 or higher, with all other values remaining same.
Though, the result is clearly evident now, but it can change based on certain circumstances.
Looking for best Mathematics Assignment Help. Whatsapp us at +16469488918 or chat with our chat representative showing on lower right corner or order from here. You can also take help from our Live Assignment helper for any exam or live assignment related assistance