QUESTION

Pay Gaps Across Equalities Areas
ANSWER
Content Table
Abstract
Introduction
Prior Knowledge
Data and Methods
Results
Conclusion
References
Tables and Figures
Abstract
The given report deals with the difference in pay gaps for the different ethno-religious groups of UK. The data for this study has been collected through primary survey and secondary reports from the UK Labor Force Survey. In this report, we tried to find out the extent to which the pay gap difference has been associated with ethnicity, religion, or both. The primary study suggests that there has been a substantial difference between the gross salaries of different ethnic and religious groups. But, we have tried to find out the possibility of any other associated factors, which could have impacted this difference.
Introduction
Wage gaps are known to occur when there is a difference between the average wages of different groups taken into consideration. This study includes wage gaps between different groups in UK based on ethnicity and religion. Ethnicity and religion based pay gap has always been a revoking topic for minority groups as they feel that they are being paid lesser than the White British people (Longhi, 2013). According to a research done in 2013, it was found out that Indian Hindus were having higher wages than Pakistani Muslims in UK, and Indian Muslims were lying in between the two, with more closeness towards Pakistani Muslims in terms of wages (Colin P. Green, 2013). Religion and ethnicity have been closely associated in this study. For example, Pakistanis and Bangladeshis have Muslim majority population, whereas British people have Christian majority population.
There have been numerous researches, which have showed significant ethnic and religious labor market disparities in UK. There could be several other possible factors also, such as relatively lower skills of religious or ethnic minority groups, not well familiar with British culture, poor communication skills in English, etc. (Brynin and Guveli, 2012). When these labor groups enter into the UK market, they face mainly two types of wage gaps, first being when they enter less well paid occupations, and second when they are paid lesser for the similar work (Simonetta Longhi and Malcolm Brynin, 2017). This research has been done to find out the main factors behind this wage gap for ethnic and religion minority groups.
Prior Knowledge
UK has been an attractive place for immigrants in search of new jobs, studies, or other needs of life. According to The Equality Act 2010, it is illegal to discriminate (in any form) employees on the basis of their race and religion. But still, there lies a significant difference in the average pay wage of British white people and other ethnic and religion minority groups. Talking about ethnicity, there are around 87% white people in UK, while rest 13% consists of Black, Asian, Mixed, or other Ethnic groups (Ethnic Pay Reporting Consultation, 2018).

The above figure has been taken from the UK Government website, and we can see that most of the population is covered by White British or White other people. A report presented at the UK government website showed that People from Indian ethnic group earn around £13.14 on an average, whereas Pakistani and Bangladeshi ethnic groups earned around £9.52 on average. Apart from the Indian ethnic group, rest all other ethnic groups were found out to have lower average hourly pay level.
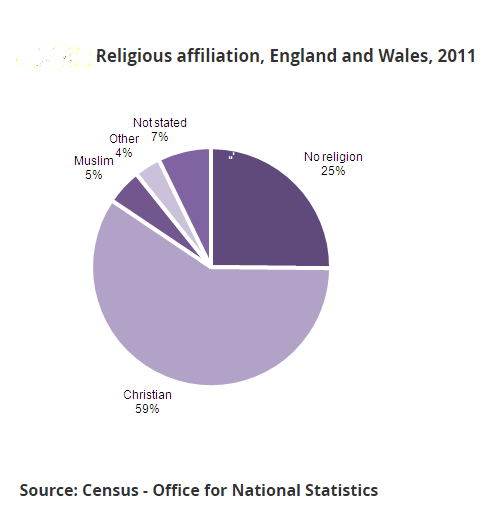
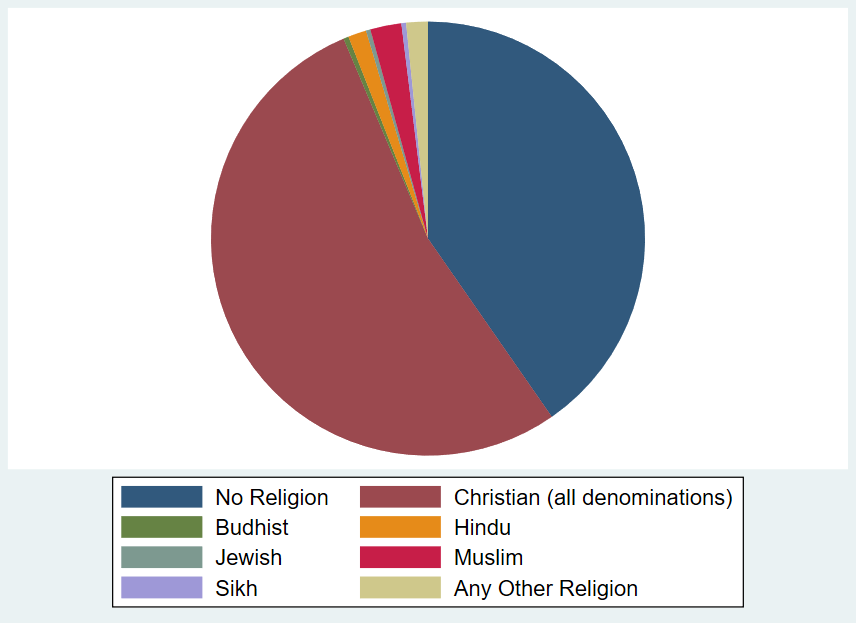
The below figure gives the report of religious affiliation in England and Wales, according to the 2011 census, and Christianity has been the most followed region in UK with an approximate distribution of around 59%, followed by Muslims (5%). Other religious groups include Hindus, Sikhs, Jews, Buddhists, and other religion. Around 7% people in that census did not give the detail of their religion, whereas 25% reported their religion as no religion.
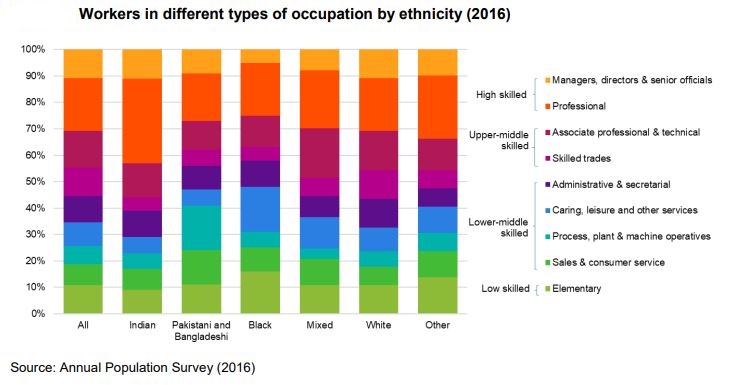
There has also been a significant difference in the job occupation for different Ethnic and religious groups. The below figure gives an idea of the occupation for different ethnicity and religion groups. For example, Indians have a larger percentage in professional occupation, whereas Pakistanis and Bangladeshis have larger percentage in the process, plant and machine operatives.
Several research papers have been published which discuss about the variation in pay gaps based on ethnicity and religion. For example, Elvira and Town (2002) reported that the performance appraisals by supervisors are influenced by the race and religion of their junior/subordinates, Castilla (2012) showed substantial evidence on a point that Blacks tend to receive smaller raises/appraisals than the Whites even with the equal rating, Elliott and Lindley (2008) showed clear evidence of ethnic pay gaps within occupation.
Data and Methods
There can be several factors on which an employee’s salary can depend upon. We have tried to cover as much characteristics as possible, for analyzing the pattern between different gross pay salaries of different ethnic and religion groups. The data for this study has been collected through the Labor Force Survey Data of UK for the duration 2002-2015. This data has been used for the primary research of the finding any particular pattern with the gross weekly pay of a person in UK.
The data consisted of demographic details such as Age, Marital Status, No of dependent children, Native country, Educational Qualification degree, etc. It also consisted of other details such as type of occupation, full time or part time job, temporary or permanent job, geographical location, usual number of hours worked, etc.
In this data, Sex and Age have been taken as controlled variables and GRSSWK (Gross Weekly Pay in Main job) is our dependent variable, for which we would perform further analysis, whereas all other variables are taken as independent variables.
A total of 10795 observations have been taken into consideration, along with a total of 47 variables. Some of these variables have been excluded on the basis of their significance level, while some have been merged into a single variable. For example, FDPCH2 represents the no of dependent children in the family aged under 2, FDPCH4 represents the no of dependent children in the family aged under 4, and so on. We have clubbed FDPCH2, FDPCH4, FDPCH9, FDPCH15, FDPCH16, and FDPCH19 and merged it as a single variable TFDPCH, which represents total no of dependent children in the family.
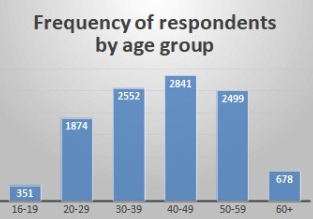
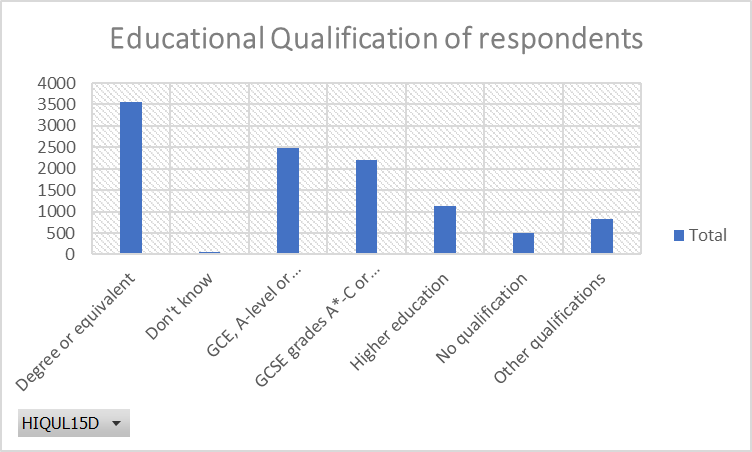
We can see a few descriptive charts below from the data, which would give an overview about the dataset. Around 52.43% of the respondents were females, whereas the age groups of the respondents followed a similar graph to the Normal Distribution, with the peak age group being 40-49. The educational qualification of respondents is also represented by the graph given below.

A total of 8 religion forms have been taken into consideration in the data, which are Christian (all denominations), Muslim, Hindu, Jewish, Sikh, Buddhist, Any Other Religion, and No Religion, which has been represented in Table 1.
Total 9 different ethnic groups are available in the data of survey, which are Bangladeshi, Black/African/Caribbean/Black British ,Chinese, Indian, Any other Asian background, Mixed/Multiple ethnic groups, Pakistani, White, and Other ethnic group, which has been represented in table 2.

The above figure gives a clear representation of the mean of Gross weekly pay distribution gender wise for different religions. It can be observed that the Hindu males have the highest weekly pay, whereas Muslim males suffer the lowest pay. Jewish female group has higher weekly pay than any other religion group.
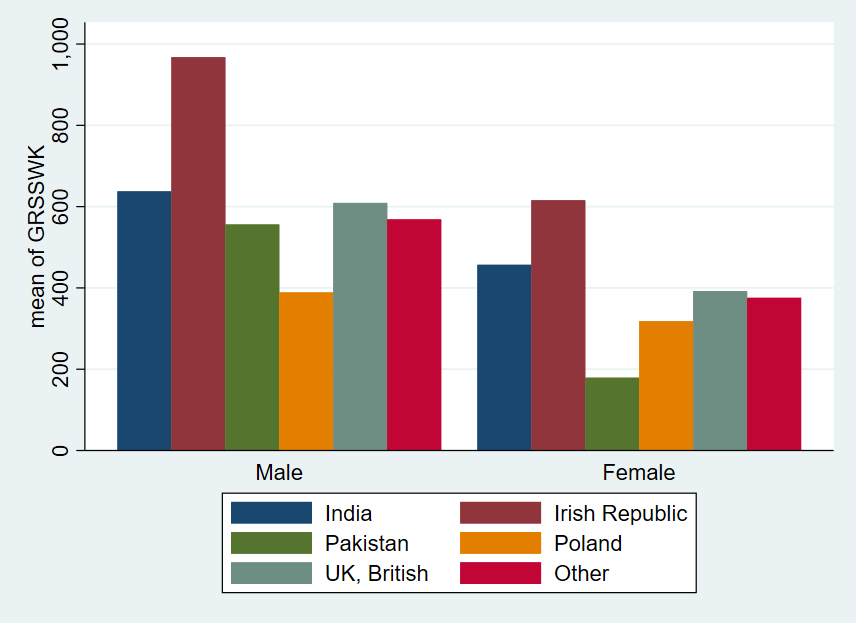
The figure above gives a detail about the wage distribution based on nationality of the respondents. Irish Republic males tend to have a higher gross weekly pay as compared to other nationality groups. However, when religion will be mixed with ethnicity, the resulting graph would be a bit different. Table 5 gives the detail about religion, ethnicity distribution of respondents.
Results
The regression analysis has been done in two forms for this report. Here, we have taken SEX, NATIONALITY, RELIGION, and GRSSWK as our variables. Rest all other variables were found insignificant in the preliminary regression analysis round with non-allowable significance values. We have performed both multivariate and bivariate regression analysis, keeping GRSSWK as our dependent variable in both cases.
For performing regression analysis, we created dummy variables for SEX, RELIGION, and NATIONALITY, which were further used in predicting the gross weekly pay of that individual. These variables are selected for analysis because of their relative importance to the salary of an individual. Gender is a very crucial factor in some cases of pay scale, especially when there is a requirement of physical strength. The nationality of an individual gives an idea about his/her personal background and the associated culture and society in which he/she has grown up. Religion has been taken into consideration so that we would be able to assess the correlation between the religion and the weekly pay of an individual.
In the case of multivariate regression analysis, it can be observed that females have a negative coefficient in the regression equation, which shows that the gross weekly pay is negatively impacted if the person is a female. Similarly, Muslims, Sikhs, and Buddhists have negative coefficient in the regression equation, which can be associated with the fact that the ethnic minority Muslim and Sikh groups are paid lesser wage as compared to other religions. Being a Hindu is the highest affecting religion factor for an individual. The nationality of Irish Republic has comparatively higher wage people, and hence, its coefficient (285.181) has the largest positive value in the whole equation. Polish nationality people have a negative correlation with the gross weekly pay as we can see that its coefficient is -159.077.
The final regression equation for the multivariate regression analysis comes out to be –
GRSSWK = 612.042 – (214.621 * Female) + {7.329 * Christian (all denominations)} – (56.877 * Buddhist) + (Hindu * 97.352) + (Jewish * 71.037) – (Muslim * 114.052) – (Sikh * 3.506) + (Any Other Religion * 44.221) + (Irish Republic * 285.181) – (Pakistan * 20.603) – (Poland * 159.077) – (UK, British * 7.579) – (Other * 33.064)
For the bivariate regression analysis, we have kept only RELIGION as our independent variable, and we have formed a regression equation to predict GRSSWK based on only religion of an individual. R square of this model was not that high, as it was not able to fully explain the variation of gross weekly pay based on religious difference. Though it has been tried to keep the model simple. When performed this regression, we observed that Muslim and Buddhist are negatively affecting the value of Gross weekly pay with their coefficient values as – 101.687 and – 85.990 respectively. Hindu and Jewish factors are the two most important ones for positively impacting the weekly pay. One of the most surprising factor of this regression has been the negative coefficient of Christian religion, which shows that Christianity affects the overall gross pay negatively, which is not the real life scenario. Due to this coefficient value, the regression equation has lost its model definition percentage i.e. the model is not able to explain the variation in GRSSWK.
The final regression equation for this regression analysis is –
GRSSWK = 498.799 – {11.883 * Christian (all denominations)} – (85.990 * Buddhist) + (Hindu * 89.493) + (Jewish * 71.812) – (Muslim * 101.687) + (Sikh * 0.622) + (Any Other Religion * 36.074)
If we compare both the regression equations, we can see that Christian and Sikh religion groups tend to impact differently. Moreover, when religion is added with gender and nationality distinction to the regression equation, the gross weekly pay predicting power is likely to increase in that case than in the case of only religion.
Conclusion
UK has been experiencing a wage gap across different ethno-religion groups. Immigrants from other countries come to UK for better earning and lifestyle, but they experience discrimination on the basis of sex, religion, ethnicity. They also have lesser acquaintance with the local British culture, due to which they could experience within occupation pay gap. There are many other controlling factors for the wages, but most of them lead to discrimination in one way or another. This study has been mainly performed to analyze the relationship between the religion or ethnicity and the wage of an individual in the UK region. After performing the analysis, it was found out that Muslims from Pakistan and Bangladesh were suffering huge wage gap with respect to British White people, whereas Indian Hindus were getting higher wages than other ethno-religion groups, if we keep all other factors as constant. This topic has been trending because it affects the monetary and social aspects of the business, and UK government is trying to reduce this ethnic and religion based wage gap as much as possible (Popov, 2018).
References
- Simonetta Longhi, 2013 Feb 07, Ethnic minority groups and wage gaps: Is there a connection, UK Data Service
- Colin. P Green, 2013 Nov 05, Performance Pay and Ethnic Earnings Differences in Britain, The University of Sheffield Website
- Malcolm Brynin and Ayse Guveli, 2012 Aug 13, Understanding the ethnic pay gap in Britain, Research Gate
- Simonetta Longhi and Malcolm Brynin, 2017 Aug, The Ethnicity Pay Gap, EqualityHumanRights.com
- Department for Business, Energy, and Industrial Strategy, 2018 Oct 06, Ethnic Pay Reporting, UK Assets Publishing Service Website
- Marta Elvira and Robert Town, 2002 Dec 17, The Effects of Race and Worker Productivity on Performance Evaluations, Wiley Online Library
- Emilio J. Castilla, 2012 Apr 23, Gender, Race, and the New (Merit‐Based) Employment Relationship, Industrial Relations – A journal of Economy and Society
- Robert Elliott and Joanne Lindley, 2008, Immigrant wage differentials, ethnicity and occupational segregation, Econpapers.repec.org
- Andrey Popov, 2018 Mar 06, Gender pay gap reporting rules should extend to ethnicity and class, The Conversation
Tables and Figures
Table 1. Frequency of religion among residents in the UK 2015
|
Religion GB level |
Freq. |
Percent |
Cum. |
|
No Religion |
4,354 |
40.33 |
40.33 |
|
Christian (all denominations) |
5,754 |
53.30 |
93.64 |
|
Buddhist |
42 |
0.39 |
94.03 |
|
Hindu |
147 |
1.36 |
95.39 |
|
Jewish |
36 |
0.33 |
95.72 |
|
Muslim |
250 |
2.32 |
98.04 |
|
Sikh |
38 |
0.35 |
98.39 |
|
Any Other Religion |
174 |
1.61 |
100.00 |
|
Total |
10,795 |
100.00 |
Note: Data taken from Labour Force Survey 2015
Table 2. Ethnicity of Respondents
|
Ethnic Group |
Number of Respondents |
|
Any other Asian background |
112 |
|
Bangladeshi |
40 |
|
Black/African/Caribbean/Black British |
222 |
|
Chinese |
35 |
|
Indian |
231 |
|
Mixed/Multiple ethnic groups |
116 |
|
Other ethnic group |
141 |
|
Pakistani |
85 |
|
White |
9813 |
Note: Data taken from Labour Force Survey 2015
Table 3. Final Multi regression table
|
GRSSWK |
Coef. |
|
SEX |
|
|
Female |
-214.621 |
|
RELIG11 |
|
|
Christian (all denominations) |
7.329 |
|
Buddhist |
-56.877 |
|
Hindu |
97.352 |
|
Jewish |
71.037 |
|
Muslim |
-114.052 |
|
Sikh |
-3.506 |
|
Any Other Religion |
44.221 |
|
NTNLTY12 |
|
|
Irish Republic |
285.181 |
|
Pakistan |
-20.603 |
|
Poland |
-159.077 |
|
UK, British |
-7.579 |
|
Other |
-33.064 |
|
_cons |
612.042 |
Note: Data taken from Labour Force Survey 2015
Table 4. Regression with single independent variable: Religion (Bivariate)
|
GRSSWK |
Coef. |
|
RELIG11 |
|
|
Christian (all denominations) |
-11.883 |
|
Buddhist |
-85.990 |
|
Hindu |
89.493 |
|
Jewish |
71.812 |
|
Muslim |
-101.687 |
|
Sikh |
0.622 |
|
Any Other Religion |
36.074 |
|
_cons |
498.799 (5.766) |
Note: Data taken from Labour Force Survey 2015
Table 5. Religion, Ethnicity distribution
|
Religion, Ethnicity |
Number of respondents |
|
Any Other Religion |
174 |
|
Any other Asian background |
1 |
|
Black/African/Caribbean/Black British |
3 |
|
Chinese |
1 |
|
Indian |
8 |
|
Mixed/Multiple ethnic groups |
4 |
|
Other ethnic group |
3 |
|
Pakistani |
3 |
|
White |
151 |
|
Budhist |
42 |
|
Any other Asian background |
25 |
|
Chinese |
4 |
|
Indian |
1 |
|
Other ethnic group |
3 |
|
White |
9 |
|
Christian (all denominations) |
5754 |
|
Any other Asian background |
35 |
|
Black/African/Caribbean/Black British |
179 |
|
Chinese |
10 |
|
Indian |
29 |
|
Mixed/Multiple ethnic groups |
52 |
|
Other ethnic group |
52 |
|
Pakistani |
2 |
|
White |
5395 |
|
Hindu |
147 |
|
Any other Asian background |
25 |
|
Indian |
111 |
|
Mixed/Multiple ethnic groups |
1 |
|
Other ethnic group |
7 |
|
Pakistani |
1 |
|
White |
2 |
|
Jewish |
36 |
|
Mixed/Multiple ethnic groups |
1 |
|
Other ethnic group |
2 |
|
White |
33 |
|
Muslim |
250 |
|
Any other Asian background |
9 |
|
Bangladeshi |
39 |
|
Black/African/Caribbean/Black British |
18 |
|
Indian |
38 |
|
Mixed/Multiple ethnic groups |
5 |
|
Other ethnic group |
42 |
|
Pakistani |
76 |
|
White |
23 |
|
No Religion |
4354 |
|
Any other Asian background |
15 |
|
Bangladeshi |
1 |
|
Black/African/Caribbean/Black British |
22 |
|
Chinese |
20 |
|
Indian |
9 |
|
Mixed/Multiple ethnic groups |
53 |
|
Other ethnic group |
31 |
|
Pakistani |
3 |
|
White |
4200 |
|
Sikh |
38 |
|
Any other Asian background |
2 |
|
Indian |
35 |
|
Other ethnic group |
1 |
Looking for best Economics Assignment Help. Whatsapp us at +16469488918 or chat with our chat representative showing on lower right corner or order from here. You can also take help from our Live Assignment helper for any exam or live assignment related assistance