QUESTION
ANSWER
Summary Statistics
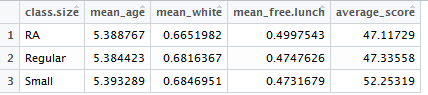
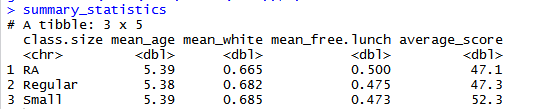
Above is the summary statistics table according to the class size. In this table, we can see that the average age of students remains almost equal across the class. The average no of whites (white or Asian) is higher is Regular and small class sizes as compared to RA class size. Apart from this, the mean value of free lunch is higher in RA as compared to Regular and Small class sizes. This tells us about the correlation of size of class and the provision of free lunch. The average score of tests (read and math) is the highest for the “Small” class size than the other two. It can be implied that the class size impacts the score of the students, the significance of which has been checked further.
1. Ans. There are total 17 missing values for the variable free.lunch in the data frame stark.
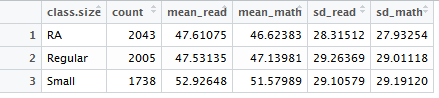
2. Ans. The no of students in each class size with valid test scores are as follows: –
RA – 2043, Regular – 2005, Small – 1738
3. Ans. The mean value of variable white is 0.677, which shows that around two-third of the students are of either white or Asian race.
4. Ans. The smallest class size i.e. “Small” performs the best in the tests with their mean scores as 52.25. The treatment effect is not significantly large.
Null Hypothesis – There is no statistically significant difference in the test scores of the three classes.
Alternate Hypothesis – There is a statistically significant difference in the test scores of the three classes.
read math Residuals
Sum of Squares 19.431 1.815 3743.676
Deg. of Freedom 1 1 5783
Residual standard error: 0.8045862
Looking at the above values, we have not able to reject the null hypothesis.
Looking for best R Assignment Help. Whatsapp us at +16469488918 or chat with our chat representative showing on lower right corner or order from here. You can also take help from our Live Assignment helper for any exam or live assignment related assistance.