QUESTION
ANSWER
1
Rnorm function has been used to generate the 500 random numbers. Set.seed(50) was used to make the results replicable.
2
The 5-number summary is generated using the fivenum() function. The results of the function are as follows:
-2.97677637 -0.61890679 -0.05556528 0.62631650 2.69544939
Min 1st Quartile Median 3rd Quartile Max
3
The results of the quantile function are as follows:
2.5% 97.5%
-1.822510 1.900145
4
The following are the theoretical quantiles:
2.5% 97.5%
-1.959964 1.959964
The positive theoretical have a larger spread than the practical quantiles calculated from the distribution generated from rnorm.
5
The mean and sd are as follows:
Mean: 62.4528
Sd: 2.355103
The theoretical quantiles are as follows:
[1] 59.43461 60.47070 61.21778 61.85614 62.45280 63.04946 63.68782
[8] 64.43490 65.47099
The practical quantiles are as follows:
10% 20% 30% 40% 50% 60% 70% 80% 90%
59.40 60.40 61.20 61.86 62.40 63.00 63.70 64.40 65.60
The theoretical results quite closely replicate the practical data gathered.
6
Theoretically normal distribution extends till infinity at 0 and 1 and thus, we do not use these values because we will receive Inf as the response.
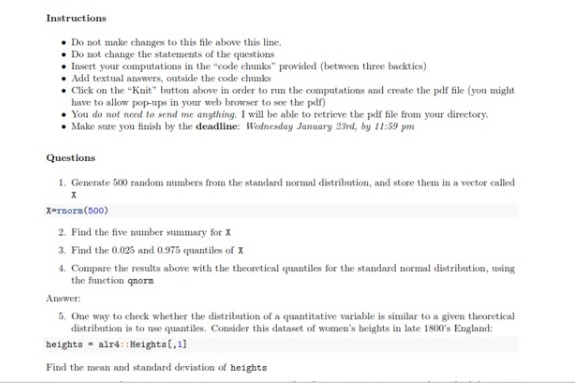
7
The following is the plot generated:
The data quantiles quite closely follow the theoretical quantiles. The data is approximately normally distributed.
8
The following is the qqplot:

It is the same as the regular plot.
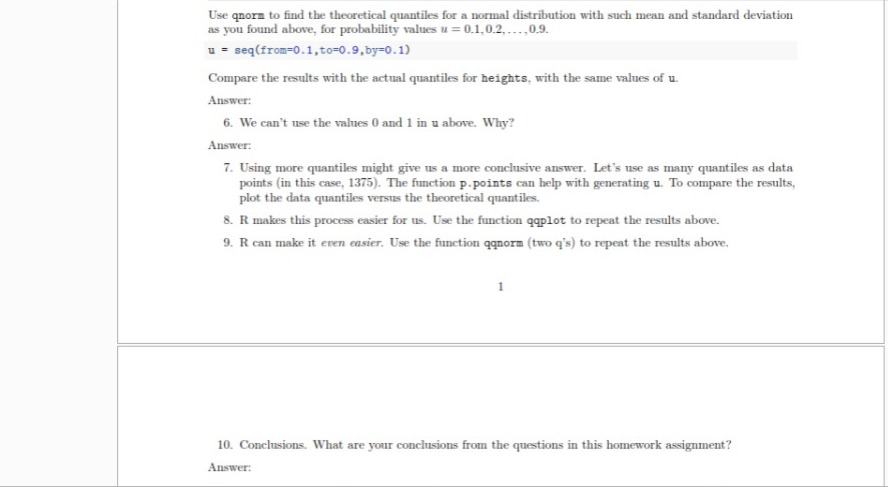
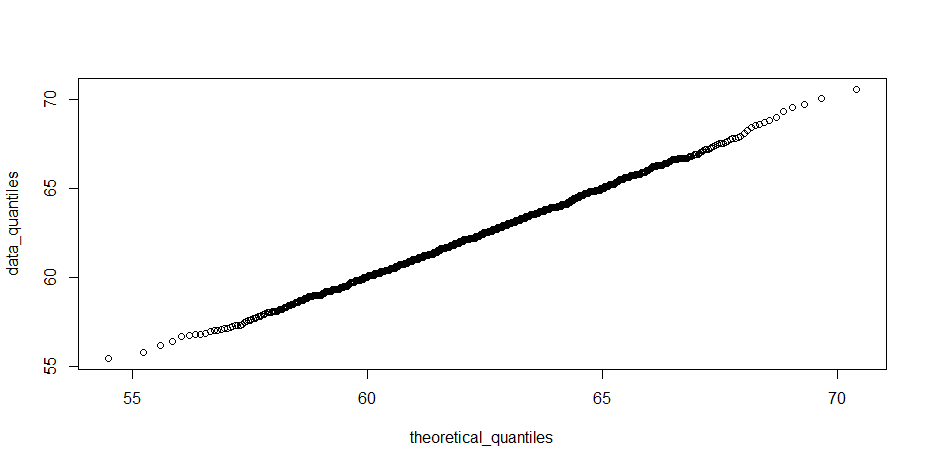
9
The following is the plot from the function qqnorm
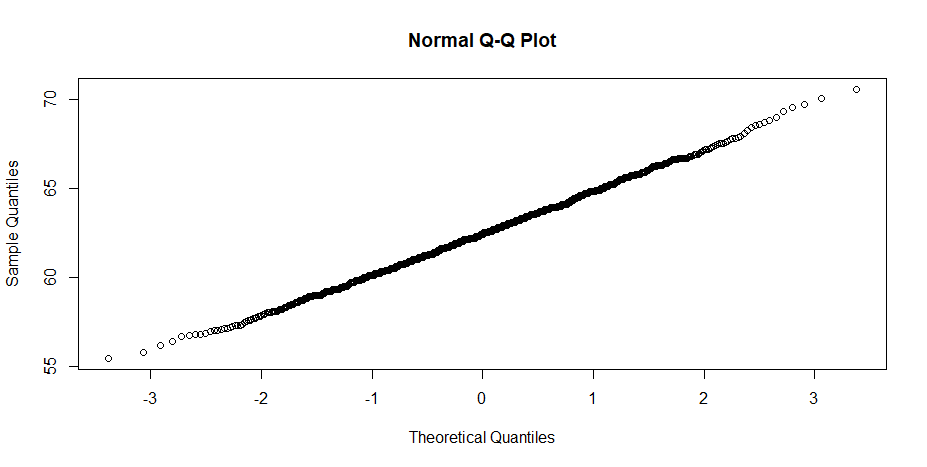
The shape is the same as the qqplot only the theoretical quantiles are in the form of Z values. Only at very high and low Z values the data differs from a theoretical distribution.
10
We can conclude that the practical data actually follows a normal distribution in many scenarios. Height is the example used in this case which is very close to being perfectly normal. The deviation only occurs at very high and low quantiles as a theoretical distribution extends to infinity whereas a practical distribution does not.
R File
## 1
set.seed(51)
X=rnorm(500)
##2
fivenum(X)
##3
quantile(X,probs = seq(0.025,0.975,0.95))
##4
qnorm(0.025)
qnorm(0.975)
##5
heights = alr4::Heights[,1]
mean(heights)
sd(heights)
u = seq(0.1,0.9,0.1)
qnorm(u,mean = mean(heights), sd = sd(heights))
quantile(heights,probs = u)
## 6
##In doc
##7
u = ppoints(1375)
theoretical_quantiles = qnorm(u,mean = mean(heights), sd = sd(heights))
data_quantiles = quantile(heights,probs = u)
plot(theoretical_quantiles ,data_quantiles)
##8
qqplot(theoretical_quantiles ,data_quantiles)
##9
qqnorm(data_quantiles)
##10
##Very high and low quantiles do not follow normal distribution
Looking for best R Assignment Help. Whatsapp us at +16469488918 or chat with our chat representative showing on lower right corner or order from here. You can also take help from our Live Assignment helper for any exam or live assignment related assistance.