QUESTION
Questions 1 – 3
The worksheet stock returns in the file Amazon_Data.xlsx contains data on monthly returns on Amazon.com stock (AMZN) and S&P500 index. The monthly returns are available for 229 months, from January 2000 to January 2019. The returns are simply proportional changes in the AMZN price and S&P index value, calculated at the market close at the end of each month. For example, a return of 4.0000 in a given month for AMZN indicates a 4% increase in the price of AMZN that month, which means that the new AMZN price is 1.04 times the closing price of the previous month. Similarly, a return of – 4.0000 indicates that the new AMZN price is 0.96 times the previous month price.
1. Consider an AMZN investor who bought AMZN stock at market open on January 1, 2000 and sold it at market close on the last trading day of January 2019. What is the most appropriate summary measure of the typical monthly return for this AMZN buy-and-hold strategy? Calculate that summary measure for this 229-month period.
A. 2.3039%
B. 1.3704%
C. 2.1516%
D. 1.7663 %
2. Using historical data on the monthly returns on AMZN as a representative sample of size n=229, how confident can you be that the monthly returns of AMZN are more likely to be positive than to be negative?
A. Less than 50% confident.
B. At least 50% confident but less than 68% confident.
C. At least 68% confident but less than 95% confident.
D. At least 95% confident but less than 98.5% confident.
E. At least 98.5% confident.
3. Find the beta for AMZN against S&P500 by running a regression with the AMZN return as the dependent variable and the S&P500 return as the independent variable. (Beta is just the slope coefficient in this regression.)
A. 0.259
B. 0.509
C. 1.667
D. 1.710
E. 11.891
Questions 4 – 6
The worksheet quarterlyrevenue in the file Amazon_Data.xlsx contains quarterly revenue data for Amazon.com (AMZN), starting from the first quarter in 2000 and up to the last quarter of 2018.
4. Run a regression with Quarterly Revenue as the dependent variable, and with time trend (Period Number) and the dummy variables representing Fiscal Quarter as the independent variables. What is the Standard Error of Regression for this regression? (Select the closest number from the choices below)
A. USD 1,445.475
B. USD 8,362.437
C. USD 8,756.599
D. USD 1,445,475,499
E. USD 8,362,437,233
F. USD 8,756,598,794
For Questions 5 and 6, run a simple regression with Quarterly Revenue as the dependent variable and with quarterly revenues from four quarters ago (i.e., same quarter from the previous year) as the independent variable.
5. Use this regression to provide a forecast for Amazon.com revenue for the first quarter of 2019.
A. USD 30.422 billion
B. USD 37,794 billion
C. USD 65.062 billion
D. USD 68,141 billion
6. Based on this regression, how confident can you be that Amazon.com revenues in the first quarter of 2019 will be at least $67.0 billion?
A. Less than 1% confident
B. At least 1% confident but less than 25% confident
C. At least 25% confident but less than 50% confident
D. At least 50% confident but less than 75% confident
E. At least 75% confident but less than 99% confident
F. At least 99% confident
Amazon Data
| Date | Year | Month | AMZN % return | SP500 return |
| 1/31/2000 | 2000 | 1 | -15.1888 | -5.0904 |
| 2/29/2000 | 2000 | 2 | 6.6796 | -2.0108 |
| 3/31/2000 | 2000 | 3 | -2.7223 | 9.6720 |
| 4/28/2000 | 2000 | 4 | -17.6306 | -3.0796 |
| 5/31/2000 | 2000 | 5 | -12.4575 | -2.1915 |
| 6/30/2000 | 2000 | 6 | -24.8383 | 2.3934 |
| 7/31/2000 | 2000 | 7 | -17.0396 | -1.6341 |
| 8/31/2000 | 2000 | 8 | 37.7593 | 6.0699 |
| 9/29/2000 | 2000 | 9 | -7.3795 | -5.3483 |
| 10/31/2000 | 2000 | 10 | -4.7154 | -0.4949 |
| 11/30/2000 | 2000 | 11 | -32.5939 | -8.0069 |
| 12/29/2000 | 2000 | 12 | -36.9620 | 0.4053 |
| 1/31/2001 | 2001 | 1 | 11.2450 | 3.4637 |
| 2/28/2001 | 2001 | 2 | -41.1552 | -9.2291 |
| 3/30/2001 | 2001 | 3 | 0.4172 | -6.4205 |
| 4/30/2001 | 2001 | 4 | 54.2522 | 7.6814 |
| 5/31/2001 | 2001 | 5 | 5.7668 | 0.5090 |
| 6/29/2001 | 2001 | 6 | -15.2187 | -2.5004 |
| 7/31/2001 | 2001 | 7 | -11.7314 | -1.0772 |
| 8/31/2001 | 2001 | 8 | -28.4227 | -6.4108 |
| 9/28/2001 | 2001 | 9 | -33.2215 | -8.1723 |
| 10/31/2001 | 2001 | 10 | 16.9179 | 1.8099 |
| 11/30/2001 | 2001 | 11 | 62.1777 | 7.5176 |
| 12/31/2001 | 2001 | 12 | -4.4170 | 0.7574 |
| 1/31/2002 | 2002 | 1 | 31.1460 | -1.5574 |
| 2/28/2002 | 2002 | 2 | -0.6342 | -2.0766 |
| 3/28/2002 | 2002 | 3 | 1.4184 | 3.6739 |
| 4/30/2002 | 2002 | 4 | 16.7133 | -6.1418 |
| 5/31/2002 | 2002 | 5 | 9.2271 | -0.9081 |
| 6/28/2002 | 2002 | 6 | -10.8612 | -7.2455 |
| 7/31/2002 | 2002 | 7 | -11.0215 | -7.9004 |
| 8/30/2002 | 2002 | 8 | 3.3266 | 0.4881 |
| 9/30/2002 | 2002 | 9 | 6.6265 | -11.0024 |
| 10/31/2002 | 2002 | 10 | 21.5317 | 8.6461 |
| 11/29/2002 | 2002 | 11 | 20.6095 | 5.7058 |
| 12/31/2002 | 2002 | 12 | -19.1006 | -6.0333 |
| 1/31/2003 | 2003 | 1 | 15.6697 | -2.7415 |
| 2/28/2003 | 2003 | 2 | 0.7323 | -1.7004 |
| 3/31/2003 | 2003 | 3 | 18.2644 | 0.8358 |
| 4/30/2003 | 2003 | 4 | 10.2190 | 8.1044 |
| 5/30/2003 | 2003 | 5 | 25.0959 | 5.0899 |
| 6/30/2003 | 2003 | 6 | 1.1981 | 1.1322 |
| 7/31/2003 | 2003 | 7 | 14.6476 | 1.6224 |
| 8/29/2003 | 2003 | 8 | 11.2392 | 1.7873 |
| 9/30/2003 | 2003 | 9 | 4.5553 | -1.1944 |
| 10/31/2003 | 2003 | 10 | 12.3890 | 5.4961 |
| 11/28/2003 | 2003 | 11 | -0.8451 | 0.7129 |
| 12/31/2003 | 2003 | 12 | -2.5014 | 5.0765 |
| 1/30/2004 | 2004 | 1 | -4.2189 | 1.7276 |
| 2/27/2004 | 2004 | 2 | -14.6627 | 1.2209 |
| 3/31/2004 | 2004 | 3 | 0.6278 | -1.6359 |
| 4/30/2004 | 2004 | 4 | 0.7394 | -1.6791 |
| 5/28/2004 | 2004 | 5 | 11.2385 | 1.2083 |
| 6/30/2004 | 2004 | 6 | 12.1649 | 1.7989 |
| 7/30/2004 | 2004 | 7 | -28.4559 | -3.4291 |
| 8/31/2004 | 2004 | 8 | -2.0041 | 0.2287 |
| 9/30/2004 | 2004 | 9 | 7.1316 | 0.9364 |
| 10/29/2004 | 2004 | 10 | -16.4709 | 1.4014 |
| 11/30/2004 | 2004 | 11 | 16.2614 | 3.8595 |
| 12/31/2004 | 2004 | 12 | 11.6179 | 3.2458 |
| 1/31/2005 | 2005 | 1 | -2.4159 | -2.5290 |
| 2/28/2005 | 2005 | 2 | -18.6025 | 1.8903 |
| 3/31/2005 | 2005 | 3 | -2.5867 | -1.9118 |
| 4/29/2005 | 2005 | 4 | -5.5734 | -2.0109 |
| 5/31/2005 | 2005 | 5 | 9.7342 | 2.9952 |
| 6/30/2005 | 2005 | 6 | -6.8150 | -0.0143 |
| 7/29/2005 | 2005 | 7 | 36.4461 | 3.5968 |
| 8/31/2005 | 2005 | 8 | -5.4264 | -1.1222 |
| 9/30/2005 | 2005 | 9 | 6.0890 | 0.6949 |
| 10/31/2005 | 2005 | 10 | -12.0088 | -1.7741 |
| 11/30/2005 | 2005 | 11 | 21.5755 | 3.5186 |
| 12/30/2005 | 2005 | 12 | -2.7033 | -0.0952 |
| 1/31/2006 | 2006 | 1 | -4.9417 | 2.5467 |
| 2/28/2006 | 2006 | 2 | -16.4659 | 0.0453 |
| 3/31/2006 | 2006 | 3 | -2.4306 | 1.1065 |
| 4/28/2006 | 2006 | 4 | -3.6135 | 1.2187 |
| 5/31/2006 | 2006 | 5 | -1.7041 | -3.0917 |
| 6/30/2006 | 2006 | 6 | 11.7596 | 0.0087 |
| 7/31/2006 | 2006 | 7 | -30.4809 | 0.5086 |
| 8/31/2006 | 2006 | 8 | 14.6523 | 2.1274 |
| 9/29/2006 | 2006 | 9 | 4.1842 | 2.4566 |
| 10/31/2006 | 2006 | 10 | 18.5866 | 3.1508 |
| 11/30/2006 | 2006 | 11 | 5.9071 | 1.6467 |
| 12/29/2006 | 2006 | 12 | -2.1815 | 1.2616 |
| 1/31/2007 | 2007 | 1 | -4.5362 | 1.4059 |
| 2/28/2007 | 2007 | 2 | 3.9023 | -2.1846 |
| 3/30/2007 | 2007 | 3 | 1.6607 | 0.9980 |
| 4/30/2007 | 2007 | 4 | 54.1342 | 4.3291 |
| 5/31/2007 | 2007 | 5 | 12.7344 | 3.2549 |
| 6/29/2007 | 2007 | 6 | -1.0558 | -1.7816 |
| 7/31/2007 | 2007 | 7 | 14.8078 | -3.1982 |
| 8/31/2007 | 2007 | 8 | 1.7443 | 1.2864 |
| 9/28/2007 | 2007 | 9 | 16.5686 | 3.5794 |
| 10/31/2007 | 2007 | 10 | -4.2941 | 1.4822 |
| 11/30/2007 | 2007 | 11 | 1.5816 | -4.4043 |
| 12/31/2007 | 2007 | 12 | 2.2968 | -0.8628 |
| 1/31/2008 | 2008 | 1 | -16.1269 | -6.1163 |
| 2/29/2008 | 2008 | 2 | -17.0270 | -3.4761 |
| 3/31/2008 | 2008 | 3 | 10.5941 | -0.5960 |
| 4/30/2008 | 2008 | 4 | 10.2805 | 4.7547 |
| 5/30/2008 | 2008 | 5 | 3.8026 | 1.0674 |
| 6/30/2008 | 2008 | 6 | -10.1568 | -8.5962 |
| 7/31/2008 | 2008 | 7 | 4.1047 | -0.9859 |
| 8/29/2008 | 2008 | 8 | 5.8554 | 1.2191 |
| 9/30/2008 | 2008 | 9 | -9.9616 | -9.0791 |
| 10/31/2008 | 2008 | 10 | -21.3304 | -16.9425 |
| 11/28/2008 | 2008 | 11 | -25.4018 | -7.4849 |
| 12/31/2008 | 2008 | 12 | 20.0937 | 0.7822 |
| 1/30/2009 | 2009 | 1 | 14.7036 | -8.5657 |
| 2/27/2009 | 2009 | 2 | 10.1496 | -10.9931 |
| 3/31/2009 | 2009 | 3 | 13.3508 | 8.5405 |
| 4/30/2009 | 2009 | 4 | 9.6405 | 9.3925 |
| 5/29/2009 | 2009 | 5 | -3.1421 | 5.3081 |
| 6/30/2009 | 2009 | 6 | 7.2702 | 0.0196 |
| 7/31/2009 | 2009 | 7 | 2.5102 | 7.4142 |
| 8/31/2009 | 2009 | 8 | -5.3288 | 3.3560 |
| 9/30/2009 | 2009 | 9 | 14.9895 | 3.5723 |
| 10/30/2009 | 2009 | 10 | 27.2601 | -1.9762 |
| 11/30/2009 | 2009 | 11 | 14.3927 | 5.7364 |
| 12/31/2009 | 2009 | 12 | -1.0227 | 1.7771 |
| 1/29/2010 | 2010 | 1 | -6.7722 | -3.6974 |
| 2/26/2010 | 2010 | 2 | -5.5897 | 2.8514 |
| 3/31/2010 | 2010 | 3 | 14.6706 | 5.8796 |
| 4/30/2010 | 2010 | 4 | 0.9796 | 1.4759 |
| 5/28/2010 | 2010 | 5 | -8.4902 | -8.1976 |
| 6/30/2010 | 2010 | 6 | -12.9125 | -5.3882 |
| 7/30/2010 | 2010 | 7 | 7.8986 | 6.8778 |
| 8/31/2010 | 2010 | 8 | 5.8868 | -4.7449 |
| 9/30/2010 | 2010 | 9 | 25.8191 | 8.7551 |
| 10/29/2010 | 2010 | 10 | 5.2018 | 3.6856 |
| 11/30/2010 | 2010 | 11 | 6.1551 | -0.2290 |
| 12/31/2010 | 2010 | 12 | 2.6226 | 6.5300 |
| 1/31/2011 | 2011 | 1 | -5.7556 | 2.2646 |
| 2/28/2011 | 2011 | 2 | 2.1516 | 3.1957 |
| 3/31/2011 | 2011 | 3 | 3.9471 | -0.1047 |
| 4/29/2011 | 2011 | 4 | 8.7048 | 2.8495 |
| 5/31/2011 | 2011 | 5 | 0.4494 | -1.3501 |
| 6/30/2011 | 2011 | 6 | 3.9656 | -1.8258 |
| 7/29/2011 | 2011 | 7 | 8.8171 | -2.1474 |
| 8/31/2011 | 2011 | 8 | -3.2761 | -5.6791 |
| 9/30/2011 | 2011 | 9 | 0.4646 | -7.1762 |
| 10/31/2011 | 2011 | 10 | -1.2579 | 10.7723 |
| 11/30/2011 | 2011 | 11 | -9.9386 | -0.5059 |
| 12/30/2011 | 2011 | 12 | -9.9797 | 0.8533 |
| 1/31/2012 | 2012 | 1 | 12.3281 | 4.3583 |
| 2/29/2012 | 2012 | 2 | -7.5859 | 4.0589 |
| 3/30/2012 | 2012 | 3 | 12.6996 | 3.1332 |
| 4/30/2012 | 2012 | 4 | 14.5129 | -0.7497 |
| 5/31/2012 | 2012 | 5 | -8.1889 | -6.2651 |
| 6/29/2012 | 2012 | 6 | 7.2519 | 3.9555 |
| 7/31/2012 | 2012 | 7 | 2.1677 | 1.2598 |
| 8/31/2012 | 2012 | 8 | 6.4166 | 1.9763 |
| 9/28/2012 | 2012 | 9 | 2.4369 | 2.4236 |
| 10/31/2012 | 2012 | 10 | -8.4252 | -1.9791 |
| 11/30/2012 | 2012 | 11 | 8.2256 | 0.2848 |
| 12/31/2012 | 2012 | 12 | -0.4682 | 0.7068 |
| 1/31/2013 | 2013 | 1 | 5.8317 | 5.0428 |
| 2/28/2013 | 2013 | 2 | -0.4633 | 1.1061 |
| 3/28/2013 | 2013 | 3 | 0.8400 | 3.5988 |
| 4/30/2013 | 2013 | 4 | -4.7582 | 1.8086 |
| 5/31/2013 | 2013 | 5 | 6.0636 | 2.0763 |
| 6/28/2013 | 2013 | 6 | 3.1538 | -1.4999 |
| 7/31/2013 | 2013 | 7 | 8.4735 | 4.9462 |
| 8/30/2013 | 2013 | 8 | -6.7193 | -3.1298 |
| 9/30/2013 | 2013 | 9 | 11.2677 | 2.9749 |
| 10/31/2013 | 2013 | 10 | 16.4374 | 4.4596 |
| 11/29/2013 | 2013 | 11 | 8.1285 | 2.8049 |
| 12/31/2013 | 2013 | 12 | 1.3134 | 2.3563 |
| 1/31/2014 | 2014 | 1 | -10.0554 | -3.5583 |
| 2/28/2014 | 2014 | 2 | 0.9507 | 4.3117 |
| 3/31/2014 | 2014 | 3 | -7.1072 | 0.6932 |
| 4/30/2014 | 2014 | 4 | -9.5833 | 0.6201 |
| 5/30/2014 | 2014 | 5 | 2.7686 | 2.1030 |
| 6/30/2014 | 2014 | 6 | 3.9130 | 1.9058 |
| 7/31/2014 | 2014 | 7 | -3.6301 | -1.5080 |
| 8/29/2014 | 2014 | 8 | 8.3229 | 3.7655 |
| 9/30/2014 | 2014 | 9 | -4.8962 | -1.5514 |
| 10/31/2014 | 2014 | 10 | -5.2661 | 2.3201 |
| 11/28/2014 | 2014 | 11 | 10.8623 | 2.4534 |
| 12/31/2014 | 2014 | 12 | -8.3540 | -0.4189 |
| 1/30/2015 | 2015 | 1 | 14.2355 | -3.1041 |
| 2/27/2015 | 2015 | 2 | 7.2293 | 5.4893 |
| 3/31/2015 | 2015 | 3 | -2.1202 | -1.7396 |
| 4/30/2015 | 2015 | 4 | 13.3512 | 0.8521 |
| 5/29/2015 | 2015 | 5 | 1.7663 | 1.0491 |
| 6/30/2015 | 2015 | 6 | 1.1323 | -2.1012 |
| 7/31/2015 | 2015 | 7 | 23.5113 | 1.9742 |
| 8/31/2015 | 2015 | 8 | -4.3383 | -6.2581 |
| 9/30/2015 | 2015 | 9 | -0.1950 | -2.6443 |
| 10/30/2015 | 2015 | 10 | 22.2724 | 8.2983 |
| 11/30/2015 | 2015 | 11 | 6.2151 | 0.0505 |
| 12/31/2015 | 2015 | 12 | 1.6682 | -1.7530 |
| 1/29/2016 | 2016 | 1 | -13.1515 | -5.0735 |
| 2/29/2016 | 2016 | 2 | -5.8739 | -0.4128 |
| 3/31/2016 | 2016 | 3 | 7.4423 | 6.5991 |
| 4/29/2016 | 2016 | 4 | 11.1094 | 0.2699 |
| 5/31/2016 | 2016 | 5 | 9.5817 | 1.5329 |
| 6/30/2016 | 2016 | 6 | -0.9920 | 0.0906 |
| 7/29/2016 | 2016 | 7 | 6.0353 | 3.5610 |
| 8/31/2016 | 2016 | 8 | 1.3640 | -0.1219 |
| 9/30/2016 | 2016 | 9 | 8.8603 | -0.1234 |
| 10/31/2016 | 2016 | 10 | -5.6717 | -1.9426 |
| 11/30/2016 | 2016 | 11 | -4.9695 | 3.4174 |
| 12/30/2016 | 2016 | 12 | -0.0933 | 1.8201 |
| 1/31/2017 | 2017 | 1 | 9.8164 | 1.7884 |
| 2/28/2017 | 2017 | 2 | 2.6182 | 3.7198 |
| 3/31/2017 | 2017 | 3 | 4.911 | -0.0389 |
| 4/30/2017 | 2017 | 4 | 4.3371 | 0.9091 |
| 5/31/2017 | 2017 | 5 | 7.5276 | 1.1576 |
| 6/30/2017 | 2017 | 6 | -2.6764 | 0.4814 |
| 7/31/2017 | 2017 | 7 | 2.0434 | 1.9349 |
| 8/31/2017 | 2017 | 8 | -0.7269 | 0.0546 |
| 9/30/2017 | 2017 | 9 | -1.9631 | 1.9303 |
| 10/31/2017 | 2017 | 10 | 14.9717 | 2.2188 |
| 11/30/2017 | 2017 | 11 | 6.4662 | 2.8083 |
| 12/31/2017 | 2017 | 12 | -0.6187 | 0.9832 |
| 1/31/2018 | 2018 | 1 | 24.0639 | 5.6179 |
| 02/28/2018 | 2018 | 2 | 4.2429 | -3.8947 |
| 03/31/2018 | 2018 | 3 | -4.3049 | -2.6885 |
| 04/30/2018 | 2018 | 4 | 8.2075 | 0.2719 |
| 05/31/2018 | 2018 | 5 | 4.0539 | 2.1608 |
| 06/30/2018 | 2018 | 6 | 4.3065 | 0.4842 |
| 07/31/2018 | 2018 | 7 | 4.5676 | 3.6022 |
| 08/31/2018 | 2018 | 8 | 13.2365 | 3.0263 |
| 09/30/2018 | 2018 | 9 | -0.4824 | 0.4294 |
| 10/31/2018 | 2018 | 10 | -20.2192 | -6.9403 |
| 11/30/2018 | 2018 | 11 | 5.7672 | 1.7859 |
| 12/31/2018 | 2018 | 12 | -11.1350 | -9.1777 |
| 1/31/2019 | 2019 | 1 | 14.4317 | 7.8684 |
| Variable Descriptions | |||||||||||
| Name | Units | Description | |||||||||
| Date | MM/DD/YYYY | This item denotes the last day of trading in a given month | |||||||||
| Year | YYYY | This item denotes year | |||||||||
| Month | MM | This item denotes month | |||||||||
| AMZN return | Number | This item denotes monthly return on AMZN in a given month | |||||||||
| SP500 return | Number | This item denotes monthly return on S&P500 index in a given month | |||||||||
| (Data obtained from Wharton Research Data Services (WRDS) – Compustat) |
ANSWER
1.Consider an AMZN investor who bought AMZN stock at market open on January 1, 2000 and sold it at market close on the last trading day of January 2019. What is the most appropriate summary measure of the typical monthly return for this AMZN buy-and-hold strategy? Calculate that summary measure for this 229-month period.
A. 2.3039%
B. 1.3704%
C. 2.1516%
D. 1.7663 %
Ans. A. 2.3039%
The value of AMZN % return is -15.1888% in Jan 2000, and 14.4317% in Jan 2019. According to the buy-and-hold strategy, the investors invest their money in the stocks for a long term. Therefore, one of the most appropriate summary measures for the typical monthly return for the AMZN buy-and-hold strategy by the given investor should be the mean percentage return value of AMZN.
The average of the AMZN percentage return comes out to be 2.3039%.
2. Using historical data on the monthly returns on AMZN as a representative sample of size n=229,how confident can you be that the monthly returns of AMZN are more likely to be positive than to be negative?
A. Less than 50% confident.
B. At least 50% confident but less than 68% confident.
C. At least 68% confident but less than 95% confident.
D. At least 95% confident but less than 98.5% confident.
E. At least 98.5% confident.
Ans. E. At least 98.5% confident.
No of successes (positive AMZN return) = 135/229 = 0.58952.
No of negatives (negative AMZN return) = 94/229 = 0.41048
Null Hypothesis – The monthly returns of AMZN are equally likely to be positive and negative.
Alternate Hypothesis – The monthly returns of AMZN are more likely to positive than to be negative.
At 98.5% Confidence Interval, z = 2.24.
So, the standard error of the estimate = 2.24*[(0.58952*0.41048)/229] = 0.072816
Range of probability = [(0.58952 – 0.072816), (0.58952 + 0.072816)] = [0.516704,0.662335]
As it can be observed that even at 98.5% Confidence, the probability is greater than 0.5, which depicts that there is not an equal probability of positive and negative return.
3.Find the beta for AMZN against S&P500 by running a regression with the AMZN return as the dependent variable and the S&P500 return as the independent variable. (Beta is just the slope coefficient in this regression.)
A. 0.259
B. 0.509
C. 1.667
D. 1.710
E. 11.891
Ans. C. 1.667
The regression model has been with AMZN return as the dependent variable with S&P500 return as the independent variable.
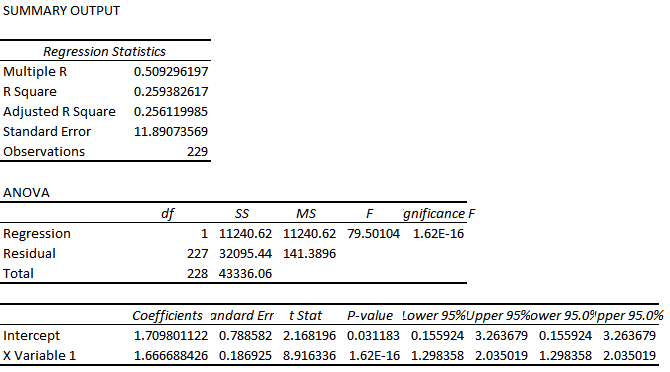
It can be clearly seen the slope coefficient i.e. Beta for this model is 1.667.
4.Run a regression with Quarterly Revenue as the dependent variable, and with time trend (Period Number) and the dummy variables representing Fiscal Quarter as the independent variables. What is the Standard Error of Regression for this regression? (Select the closest number from choices below)A. USD 1,445.475
B. USD 8,362.437
C. USD 8,756.599
D. USD 1,445,475,499
E. USD 8,362,437,233
F. USD 8,756,598,794
Ans. E. USD 8,362,437,233
The regression model has been built with Quarterly Revenue as the dependent variable, while Period Number & Dummy variables for the Fiscal Quarter as the independent variables.
The standard error of regression comes out to be USD 8362.437 million.
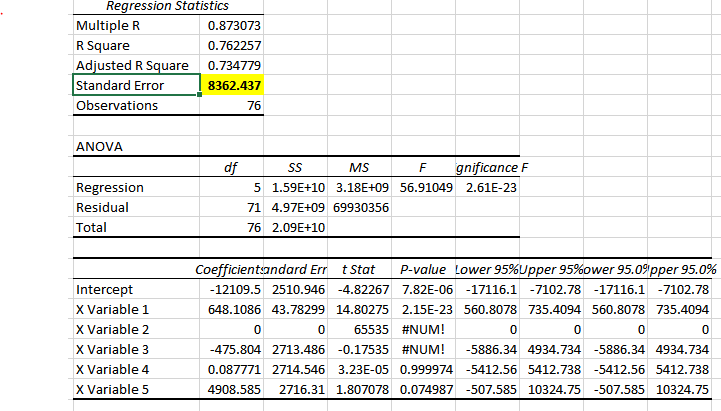
All the values given in figure are in Millions USD.
5.Use this regression to provide a forecast for Amazon.com revenue for the first quarter of 2019.
A. USD 30.422 billion
B. USD 37,794 billion
C. USD 65.062 billion
D. USD 68,141 billion
Ans. C. USD 65.062 billion
In this regression model, the Quarterly Revenue has been kept as the dependent variable, and the quarterly revenues four quarters ago (i.e., same quarter from the previous year) has been taken as the independent variable.
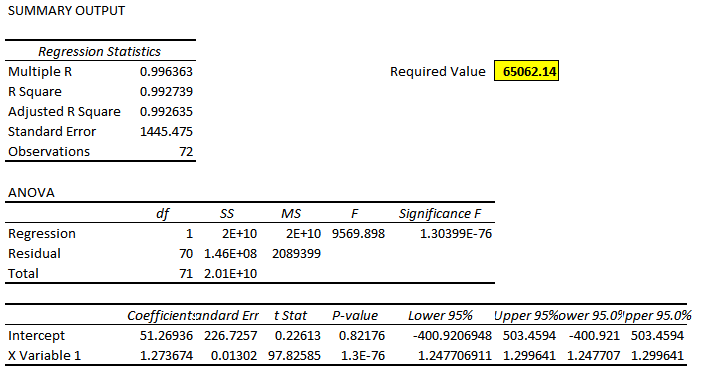
Predicted Value for a quarter = 51.26936 + (1.273674 * Same Quarter of Previous Year Revenue)
The values are present here in Million USD.
6.Based on this regression, how confident can you be that Amazon.com revenues in the first quarter of 2019 will be at least $67.0 billion?
A. Less than 1% confident
B. At least 1% confident but less than 25% confident
C. At least 25% confident but less than 50% confident
D. At least 50% confident but less than 75% confident
E. At least 75% confident but less than 99% confident
F. At least 99% confident
Ans. B. At least 1% confident but less than 25% confident
When the regression line was checked for 99% Confidence Interval, the slope of the variable i.e. Beta varied from 1.2392 to 1.308149. The values of upper and lower confidence interval at 99% are 67422.17 and 62702.11106 respectively. However, when these values were checked at 95% CI, those were 63284.5354 and 66839.75 respectively.
Hence, while telling that the Amazon.com revenues in the first quarter of 2019 would be at least $67.0 billion, we would be at least 1% confident but less than 25% confident.
Regression Stock
| SUMMARY OUTPUT | |||||||||
| Regression Statistics | |||||||||
| Multiple R | 0.509296197389589 | ||||||||
| R Square | 0.259382616675495 | ||||||||
| Adjusted R Square | 0.256119985030894 | ||||||||
| Standard Error | 11.8907356934092 | ||||||||
| Observations | 229 | ||||||||
| ANOVA | |||||||||
| df | SS | MS | F | Significance F | |||||
| Regression | 1 | 11240.6202116634 | 11240.6202116634 | 79.5010423884945 | 1.62229157024757E-16 | ||||
| Residual | 227 | 32095.4381400271 | 141.389595330516 | ||||||
| Total | 228 | 43336.0583516906 | |||||||
| Coefficients | Standard Error | t Stat | P-value | Lower 95% | Upper 95% | Lower 95.0% | Upper 95.0% | ||
| Intercept | 1.70980112228447 | 0.788582352529088 | 2.16819602518483 | 0.031183412005486 | 0.155923638410927 | 3.26367860615802 | 0.155923638410927 | 3.26367860615802 | |
| X Variable 1 | 1.66668842619251 | 0.18692526633145 | 8.91633570411608 | 1.62229157024718E-16 | 1.29835788774213 | 2.03501896464289 | 1.29835788774213 | 2.03501896464289 | |
Stock Returns
| Date | Year | Month | AMZN % return | SP500 return |
| 1/31/2000 | 2000 | 1 | -15.1888 | -5.0904 |
| 2/29/2000 | 2000 | 2 | 6.6796 | -2.0108 |
| 3/31/2000 | 2000 | 3 | -2.7223 | 9.6720 |
| 4/28/2000 | 2000 | 4 | -17.6306 | -3.0796 |
| 5/31/2000 | 2000 | 5 | -12.4575 | -2.1915 |
| 6/30/2000 | 2000 | 6 | -24.8383 | 2.3934 |
| 7/31/2000 | 2000 | 7 | -17.0396 | -1.6341 |
| 8/31/2000 | 2000 | 8 | 37.7593 | 6.0699 |
| 9/29/2000 | 2000 | 9 | -7.3795 | -5.3483 |
| 10/31/2000 | 2000 | 10 | -4.7154 | -0.4949 |
| 11/30/2000 | 2000 | 11 | -32.5939 | -8.0069 |
| 12/29/2000 | 2000 | 12 | -36.9620 | 0.4053 |
| 1/31/2001 | 2001 | 1 | 11.2450 | 3.4637 |
| 2/28/2001 | 2001 | 2 | -41.1552 | -9.2291 |
| 3/30/2001 | 2001 | 3 | 0.4172 | -6.4205 |
| 4/30/2001 | 2001 | 4 | 54.2522 | 7.6814 |
| 5/31/2001 | 2001 | 5 | 5.7668 | 0.5090 |
| 6/29/2001 | 2001 | 6 | -15.2187 | -2.5004 |
| 7/31/2001 | 2001 | 7 | -11.7314 | -1.0772 |
| 8/31/2001 | 2001 | 8 | -28.4227 | -6.4108 |
| 9/28/2001 | 2001 | 9 | -33.2215 | -8.1723 |
| 10/31/2001 | 2001 | 10 | 16.9179 | 1.8099 |
| 11/30/2001 | 2001 | 11 | 62.1777 | 7.5176 |
| 12/31/2001 | 2001 | 12 | -4.4170 | 0.7574 |
| 1/31/2002 | 2002 | 1 | 31.1460 | -1.5574 |
| 2/28/2002 | 2002 | 2 | -0.6342 | -2.0766 |
| 3/28/2002 | 2002 | 3 | 1.4184 | 3.6739 |
| 4/30/2002 | 2002 | 4 | 16.7133 | -6.1418 |
| 5/31/2002 | 2002 | 5 | 9.2271 | -0.9081 |
| 6/28/2002 | 2002 | 6 | -10.8612 | -7.2455 |
| 7/31/2002 | 2002 | 7 | -11.0215 | -7.9004 |
| 8/30/2002 | 2002 | 8 | 3.3266 | 0.4881 |
| 9/30/2002 | 2002 | 9 | 6.6265 | -11.0024 |
| 10/31/2002 | 2002 | 10 | 21.5317 | 8.6461 |
| 11/29/2002 | 2002 | 11 | 20.6095 | 5.7058 |
| 12/31/2002 | 2002 | 12 | -19.1006 | -6.0333 |
| 1/31/2003 | 2003 | 1 | 15.6697 | -2.7415 |
| 2/28/2003 | 2003 | 2 | 0.7323 | -1.7004 |
| 3/31/2003 | 2003 | 3 | 18.2644 | 0.8358 |
| 4/30/2003 | 2003 | 4 | 10.2190 | 8.1044 |
| 5/30/2003 | 2003 | 5 | 25.0959 | 5.0899 |
| 6/30/2003 | 2003 | 6 | 1.1981 | 1.1322 |
| 7/31/2003 | 2003 | 7 | 14.6476 | 1.6224 |
| 8/29/2003 | 2003 | 8 | 11.2392 | 1.7873 |
| 9/30/2003 | 2003 | 9 | 4.5553 | -1.1944 |
| 10/31/2003 | 2003 | 10 | 12.3890 | 5.4961 |
| 11/28/2003 | 2003 | 11 | -0.8451 | 0.7129 |
| 12/31/2003 | 2003 | 12 | -2.5014 | 5.0765 |
| 1/30/2004 | 2004 | 1 | -4.2189 | 1.7276 |
| 2/27/2004 | 2004 | 2 | -14.6627 | 1.2209 |
| 3/31/2004 | 2004 | 3 | 0.6278 | -1.6359 |
| 4/30/2004 | 2004 | 4 | 0.7394 | -1.6791 |
| 5/28/2004 | 2004 | 5 | 11.2385 | 1.2083 |
| 6/30/2004 | 2004 | 6 | 12.1649 | 1.7989 |
| 7/30/2004 | 2004 | 7 | -28.4559 | -3.4291 |
| 8/31/2004 | 2004 | 8 | -2.0041 | 0.2287 |
| 9/30/2004 | 2004 | 9 | 7.1316 | 0.9364 |
| 10/29/2004 | 2004 | 10 | -16.4709 | 1.4014 |
| 11/30/2004 | 2004 | 11 | 16.2614 | 3.8595 |
| 12/31/2004 | 2004 | 12 | 11.6179 | 3.2458 |
| 1/31/2005 | 2005 | 1 | -2.4159 | -2.5290 |
| 2/28/2005 | 2005 | 2 | -18.6025 | 1.8903 |
| 3/31/2005 | 2005 | 3 | -2.5867 | -1.9118 |
| 4/29/2005 | 2005 | 4 | -5.5734 | -2.0109 |
| 5/31/2005 | 2005 | 5 | 9.7342 | 2.9952 |
| 6/30/2005 | 2005 | 6 | -6.8150 | -0.0143 |
| 7/29/2005 | 2005 | 7 | 36.4461 | 3.5968 |
| 8/31/2005 | 2005 | 8 | -5.4264 | -1.1222 |
| 9/30/2005 | 2005 | 9 | 6.0890 | 0.6949 |
| 10/31/2005 | 2005 | 10 | -12.0088 | -1.7741 |
| 11/30/2005 | 2005 | 11 | 21.5755 | 3.5186 |
| 12/30/2005 | 2005 | 12 | -2.7033 | -0.0952 |
| 1/31/2006 | 2006 | 1 | -4.9417 | 2.5467 |
| 2/28/2006 | 2006 | 2 | -16.4659 | 0.0453 |
| 3/31/2006 | 2006 | 3 | -2.4306 | 1.1065 |
| 4/28/2006 | 2006 | 4 | -3.6135 | 1.2187 |
| 5/31/2006 | 2006 | 5 | -1.7041 | -3.0917 |
| 6/30/2006 | 2006 | 6 | 11.7596 | 0.0087 |
| 7/31/2006 | 2006 | 7 | -30.4809 | 0.5086 |
| 8/31/2006 | 2006 | 8 | 14.6523 | 2.1274 |
| 9/29/2006 | 2006 | 9 | 4.1842 | 2.4566 |
| 10/31/2006 | 2006 | 10 | 18.5866 | 3.1508 |
| 11/30/2006 | 2006 | 11 | 5.9071 | 1.6467 |
| 12/29/2006 | 2006 | 12 | -2.1815 | 1.2616 |
| 1/31/2007 | 2007 | 1 | -4.5362 | 1.4059 |
| 2/28/2007 | 2007 | 2 | 3.9023 | -2.1846 |
| 3/30/2007 | 2007 | 3 | 1.6607 | 0.9980 |
| 4/30/2007 | 2007 | 4 | 54.1342 | 4.3291 |
| 5/31/2007 | 2007 | 5 | 12.7344 | 3.2549 |
| 6/29/2007 | 2007 | 6 | -1.0558 | -1.7816 |
| 7/31/2007 | 2007 | 7 | 14.8078 | -3.1982 |
| 8/31/2007 | 2007 | 8 | 1.7443 | 1.2864 |
| 9/28/2007 | 2007 | 9 | 16.5686 | 3.5794 |
| 10/31/2007 | 2007 | 10 | -4.2941 | 1.4822 |
| 11/30/2007 | 2007 | 11 | 1.5816 | -4.4043 |
| 12/31/2007 | 2007 | 12 | 2.2968 | -0.8628 |
| 1/31/2008 | 2008 | 1 | -16.1269 | -6.1163 |
| 2/29/2008 | 2008 | 2 | -17.0270 | -3.4761 |
| 3/31/2008 | 2008 | 3 | 10.5941 | -0.5960 |
| 4/30/2008 | 2008 | 4 | 10.2805 | 4.7547 |
| 5/30/2008 | 2008 | 5 | 3.8026 | 1.0674 |
| 6/30/2008 | 2008 | 6 | -10.1568 | -8.5962 |
| 7/31/2008 | 2008 | 7 | 4.1047 | -0.9859 |
| 8/29/2008 | 2008 | 8 | 5.8554 | 1.2191 |
| 9/30/2008 | 2008 | 9 | -9.9616 | -9.0791 |
| 10/31/2008 | 2008 | 10 | -21.3304 | -16.9425 |
| 11/28/2008 | 2008 | 11 | -25.4018 | -7.4849 |
| 12/31/2008 | 2008 | 12 | 20.0937 | 0.7822 |
| 1/30/2009 | 2009 | 1 | 14.7036 | -8.5657 |
| 2/27/2009 | 2009 | 2 | 10.1496 | -10.9931 |
| 3/31/2009 | 2009 | 3 | 13.3508 | 8.5405 |
| 4/30/2009 | 2009 | 4 | 9.6405 | 9.3925 |
| 5/29/2009 | 2009 | 5 | -3.1421 | 5.3081 |
| 6/30/2009 | 2009 | 6 | 7.2702 | 0.0196 |
| 7/31/2009 | 2009 | 7 | 2.5102 | 7.4142 |
| 8/31/2009 | 2009 | 8 | -5.3288 | 3.3560 |
| 9/30/2009 | 2009 | 9 | 14.9895 | 3.5723 |
| 10/30/2009 | 2009 | 10 | 27.2601 | -1.9762 |
| 11/30/2009 | 2009 | 11 | 14.3927 | 5.7364 |
| 12/31/2009 | 2009 | 12 | -1.0227 | 1.7771 |
| 1/29/2010 | 2010 | 1 | -6.7722 | -3.6974 |
| 2/26/2010 | 2010 | 2 | -5.5897 | 2.8514 |
| 3/31/2010 | 2010 | 3 | 14.6706 | 5.8796 |
| 4/30/2010 | 2010 | 4 | 0.9796 | 1.4759 |
| 5/28/2010 | 2010 | 5 | -8.4902 | -8.1976 |
| 6/30/2010 | 2010 | 6 | -12.9125 | -5.3882 |
| 7/30/2010 | 2010 | 7 | 7.8986 | 6.8778 |
| 8/31/2010 | 2010 | 8 | 5.8868 | -4.7449 |
| 9/30/2010 | 2010 | 9 | 25.8191 | 8.7551 |
| 10/29/2010 | 2010 | 10 | 5.2018 | 3.6856 |
| 11/30/2010 | 2010 | 11 | 6.1551 | -0.2290 |
| 12/31/2010 | 2010 | 12 | 2.6226 | 6.5300 |
| 1/31/2011 | 2011 | 1 | -5.7556 | 2.2646 |
| 2/28/2011 | 2011 | 2 | 2.1516 | 3.1957 |
| 3/31/2011 | 2011 | 3 | 3.9471 | -0.1047 |
| 4/29/2011 | 2011 | 4 | 8.7048 | 2.8495 |
| 5/31/2011 | 2011 | 5 | 0.4494 | -1.3501 |
| 6/30/2011 | 2011 | 6 | 3.9656 | -1.8258 |
| 7/29/2011 | 2011 | 7 | 8.8171 | -2.1474 |
| 8/31/2011 | 2011 | 8 | -3.2761 | -5.6791 |
| 9/30/2011 | 2011 | 9 | 0.4646 | -7.1762 |
| 10/31/2011 | 2011 | 10 | -1.2579 | 10.7723 |
| 11/30/2011 | 2011 | 11 | -9.9386 | -0.5059 |
| 12/30/2011 | 2011 | 12 | -9.9797 | 0.8533 |
| 1/31/2012 | 2012 | 1 | 12.3281 | 4.3583 |
| 2/29/2012 | 2012 | 2 | -7.5859 | 4.0589 |
| 3/30/2012 | 2012 | 3 | 12.6996 | 3.1332 |
| 4/30/2012 | 2012 | 4 | 14.5129 | -0.7497 |
| 5/31/2012 | 2012 | 5 | -8.1889 | -6.2651 |
| 6/29/2012 | 2012 | 6 | 7.2519 | 3.9555 |
| 7/31/2012 | 2012 | 7 | 2.1677 | 1.2598 |
| 8/31/2012 | 2012 | 8 | 6.4166 | 1.9763 |
| 9/28/2012 | 2012 | 9 | 2.4369 | 2.4236 |
| 10/31/2012 | 2012 | 10 | -8.4252 | -1.9791 |
| 11/30/2012 | 2012 | 11 | 8.2256 | 0.2848 |
| 12/31/2012 | 2012 | 12 | -0.4682 | 0.7068 |
| 1/31/2013 | 2013 | 1 | 5.8317 | 5.0428 |
| 2/28/2013 | 2013 | 2 | -0.4633 | 1.1061 |
| 3/28/2013 | 2013 | 3 | 0.8400 | 3.5988 |
| 4/30/2013 | 2013 | 4 | -4.7582 | 1.8086 |
| 5/31/2013 | 2013 | 5 | 6.0636 | 2.0763 |
| 6/28/2013 | 2013 | 6 | 3.1538 | -1.4999 |
| 7/31/2013 | 2013 | 7 | 8.4735 | 4.9462 |
| 8/30/2013 | 2013 | 8 | -6.7193 | -3.1298 |
| 9/30/2013 | 2013 | 9 | 11.2677 | 2.9749 |
| 10/31/2013 | 2013 | 10 | 16.4374 | 4.4596 |
| 11/29/2013 | 2013 | 11 | 8.1285 | 2.8049 |
| 12/31/2013 | 2013 | 12 | 1.3134 | 2.3563 |
| 1/31/2014 | 2014 | 1 | -10.0554 | -3.5583 |
| 2/28/2014 | 2014 | 2 | 0.9507 | 4.3117 |
| 3/31/2014 | 2014 | 3 | -7.1072 | 0.6932 |
| 4/30/2014 | 2014 | 4 | -9.5833 | 0.6201 |
| 5/30/2014 | 2014 | 5 | 2.7686 | 2.1030 |
| 6/30/2014 | 2014 | 6 | 3.9130 | 1.9058 |
| 7/31/2014 | 2014 | 7 | -3.6301 | -1.5080 |
| 8/29/2014 | 2014 | 8 | 8.3229 | 3.7655 |
| 9/30/2014 | 2014 | 9 | -4.8962 | -1.5514 |
| 10/31/2014 | 2014 | 10 | -5.2661 | 2.3201 |
| 11/28/2014 | 2014 | 11 | 10.8623 | 2.4534 |
| 12/31/2014 | 2014 | 12 | -8.3540 | -0.4189 |
| 1/30/2015 | 2015 | 1 | 14.2355 | -3.1041 |
| 2/27/2015 | 2015 | 2 | 7.2293 | 5.4893 |
| 3/31/2015 | 2015 | 3 | -2.1202 | -1.7396 |
| 4/30/2015 | 2015 | 4 | 13.3512 | 0.8521 |
| 5/29/2015 | 2015 | 5 | 1.7663 | 1.0491 |
| 6/30/2015 | 2015 | 6 | 1.1323 | -2.1012 |
| 7/31/2015 | 2015 | 7 | 23.5113 | 1.9742 |
| 8/31/2015 | 2015 | 8 | -4.3383 | -6.2581 |
| 9/30/2015 | 2015 | 9 | -0.1950 | -2.6443 |
| 10/30/2015 | 2015 | 10 | 22.2724 | 8.2983 |
| 11/30/2015 | 2015 | 11 | 6.2151 | 0.0505 |
| 12/31/2015 | 2015 | 12 | 1.6682 | -1.7530 |
| 1/29/2016 | 2016 | 1 | -13.1515 | -5.0735 |
| 2/29/2016 | 2016 | 2 | -5.8739 | -0.4128 |
| 3/31/2016 | 2016 | 3 | 7.4423 | 6.5991 |
| 4/29/2016 | 2016 | 4 | 11.1094 | 0.2699 |
| 5/31/2016 | 2016 | 5 | 9.5817 | 1.5329 |
| 6/30/2016 | 2016 | 6 | -0.9920 | 0.0906 |
| 7/29/2016 | 2016 | 7 | 6.0353 | 3.5610 |
| 8/31/2016 | 2016 | 8 | 1.3640 | -0.1219 |
| 9/30/2016 | 2016 | 9 | 8.8603 | -0.1234 |
| 10/31/2016 | 2016 | 10 | -5.6717 | -1.9426 |
| 11/30/2016 | 2016 | 11 | -4.9695 | 3.4174 |
| 12/30/2016 | 2016 | 12 | -0.0933 | 1.8201 |
| 1/31/2017 | 2017 | 1 | 9.8164 | 1.7884 |
| 2/28/2017 | 2017 | 2 | 2.6182 | 3.7198 |
| 3/31/2017 | 2017 | 3 | 4.911 | -0.0389 |
| 4/30/2017 | 2017 | 4 | 4.3371 | 0.9091 |
| 5/31/2017 | 2017 | 5 | 7.5276 | 1.1576 |
| 6/30/2017 | 2017 | 6 | -2.6764 | 0.4814 |
| 7/31/2017 | 2017 | 7 | 2.0434 | 1.9349 |
| 8/31/2017 | 2017 | 8 | -0.7269 | 0.0546 |
| 9/30/2017 | 2017 | 9 | -1.9631 | 1.9303 |
| 10/31/2017 | 2017 | 10 | 14.9717 | 2.2188 |
| 11/30/2017 | 2017 | 11 | 6.4662 | 2.8083 |
| 12/31/2017 | 2017 | 12 | -0.6187 | 0.9832 |
| 1/31/2018 | 2018 | 1 | 24.0639 | 5.6179 |
| 02/28/2018 | 2018 | 2 | 4.2429 | -3.8947 |
| 03/31/2018 | 2018 | 3 | -4.3049 | -2.6885 |
| 04/30/2018 | 2018 | 4 | 8.2075 | 0.2719 |
| 05/31/2018 | 2018 | 5 | 4.0539 | 2.1608 |
| 06/30/2018 | 2018 | 6 | 4.3065 | 0.4842 |
| 07/31/2018 | 2018 | 7 | 4.5676 | 3.6022 |
| 08/31/2018 | 2018 | 8 | 13.2365 | 3.0263 |
| 09/30/2018 | 2018 | 9 | -0.4824 | 0.4294 |
| 10/31/2018 | 2018 | 10 | -20.2192 | -6.9403 |
| 11/30/2018 | 2018 | 11 | 5.7672 | 1.7859 |
| 12/31/2018 | 2018 | 12 | -11.1350 | -9.1777 |
| 1/31/2019 | 2019 | 1 | 14.4317 | 7.8684 |
| Variable Descriptions | |||||||||||
| Name | Units | Description | |||||||||
| Date | MM/DD/YYYY | This item denotes the last day of trading in a given month | |||||||||
| Year | YYYY | This item denotes year | |||||||||
| Month | MM | This item denotes month | |||||||||
| AMZN return | Number | This item denotes monthly return on AMZN in a given month | |||||||||
| SP500 return | Number | This item denotes monthly return on S&P500 index in a given month | |||||||||
| (Data obtained from Wharton Research Data Services (WRDS) – Compustat) |
Quarterly Revenue
| Date | Fiscal Year |
Fiscal Quarter | Period Number | Quarterly Revenue |
| 03/31/2000 | 2000 | 1 | 1 | 573.889 |
| 06/30/2000 | 2000 | 2 | 2 | 577.876 |
| 09/30/2000 | 2000 | 3 | 3 | 637.858 |
| 12/31/2000 | 2000 | 4 | 4 | 972.36 |
| 03/31/2001 | 2001 | 1 | 5 | 700.356 |
| 06/30/2001 | 2001 | 2 | 6 | 667.625 |
| 09/30/2001 | 2001 | 3 | 7 | 639.281 |
| 12/31/2001 | 2001 | 4 | 8 | 1115.171 |
| 03/31/2002 | 2002 | 1 | 9 | 847.422 |
| 06/30/2002 | 2002 | 2 | 10 | 805.605 |
| 09/30/2002 | 2002 | 3 | 11 | 851.299 |
| 12/31/2002 | 2002 | 4 | 12 | 1428.61 |
| 03/31/2003 | 2003 | 1 | 13 | 1083.559 |
| 06/30/2003 | 2003 | 2 | 14 | 1099.912 |
| 09/30/2003 | 2003 | 3 | 15 | 1134.456 |
| 12/31/2003 | 2003 | 4 | 16 | 1945.772 |
| 03/31/2004 | 2004 | 1 | 17 | 1530.349 |
| 06/30/2004 | 2004 | 2 | 18 | 1387.341 |
| 09/30/2004 | 2004 | 3 | 19 | 1462.475 |
| 12/31/2004 | 2004 | 4 | 20 | 2540.959 |
| 03/31/2005 | 2005 | 1 | 21 | 1902 |
| 06/30/2005 | 2005 | 2 | 22 | 1753 |
| 09/30/2005 | 2005 | 3 | 23 | 1858 |
| 12/31/2005 | 2005 | 4 | 24 | 2977 |
| 03/31/2006 | 2006 | 1 | 25 | 2279 |
| 06/30/2006 | 2006 | 2 | 26 | 2139 |
| 09/30/2006 | 2006 | 3 | 27 | 2307 |
| 12/31/2006 | 2006 | 4 | 28 | 3986 |
| 03/31/2007 | 2007 | 1 | 29 | 3015 |
| 06/30/2007 | 2007 | 2 | 30 | 2886 |
| 09/30/2007 | 2007 | 3 | 31 | 3262 |
| 12/31/2007 | 2007 | 4 | 32 | 5672 |
| 03/31/2008 | 2008 | 1 | 33 | 4135 |
| 06/30/2008 | 2008 | 2 | 34 | 4063 |
| 09/30/2008 | 2008 | 3 | 35 | 4265 |
| 12/31/2008 | 2008 | 4 | 36 | 6703 |
| 03/31/2009 | 2009 | 1 | 37 | 4889 |
| 06/30/2009 | 2009 | 2 | 38 | 4652 |
| 09/30/2009 | 2009 | 3 | 39 | 5448 |
| 12/31/2009 | 2009 | 4 | 40 | 9520 |
| 03/31/2010 | 2010 | 1 | 41 | 7131 |
| 06/30/2010 | 2010 | 2 | 42 | 6566 |
| 09/30/2010 | 2010 | 3 | 43 | 7560 |
| 12/31/2010 | 2010 | 4 | 44 | 12947 |
| 03/31/2011 | 2011 | 1 | 45 | 9857 |
| 06/30/2011 | 2011 | 2 | 46 | 9913 |
| 09/30/2011 | 2011 | 3 | 47 | 10876 |
| 12/31/2011 | 2011 | 4 | 48 | 17431 |
| 03/31/2012 | 2012 | 1 | 49 | 13185 |
| 06/30/2012 | 2012 | 2 | 50 | 12834 |
| 09/30/2012 | 2012 | 3 | 51 | 13806 |
| 12/31/2012 | 2012 | 4 | 52 | 21268 |
| 03/31/2013 | 2013 | 1 | 53 | 16070 |
| 06/30/2013 | 2013 | 2 | 54 | 15700 |
| 09/30/2013 | 2013 | 3 | 55 | 17092 |
| 12/31/2013 | 2013 | 4 | 56 | 25587 |
| 03/31/2014 | 2014 | 1 | 57 | 19741 |
| 06/30/2014 | 2014 | 2 | 58 | 19340 |
| 09/30/2014 | 2014 | 3 | 59 | 20579 |
| 12/31/2014 | 2014 | 4 | 60 | 29328 |
| 03/31/2015 | 2015 | 1 | 61 | 22717 |
| 06/30/2015 | 2015 | 2 | 62 | 23185 |
| 09/30/2015 | 2015 | 3 | 63 | 25358 |
| 12/31/2015 | 2015 | 4 | 64 | 35747 |
| 03/31/2016 | 2016 | 1 | 65 | 29128 |
| 06/30/2016 | 2016 | 2 | 66 | 30404 |
| 09/30/2016 | 2016 | 3 | 67 | 32714 |
| 12/31/2016 | 2016 | 4 | 68 | 43741 |
| 3/31/2017 | 2017 | 1 | 69 | 35714 |
| 6/30/2017 | 2017 | 2 | 70 | 37955 |
| 9/30/2017 | 2017 | 3 | 71 | 43744 |
| 12/31/2017 | 2017 | 4 | 72 | 60453 |
| 3/31/2018 | 2018 | 1 | 73 | 51042 |
| 6/30/2018 | 2018 | 2 | 74 | 52886 |
| 9/30/2018 | 2018 | 3 | 75 | 56576 |
| 12/31/2018 | 2018 | 4 | 76 | 72383 |
| Variable Descriptions | |||||||||||
| Name | Units | Description | |||||||||
| Date | Date | Fiscal quarter closing date | |||||||||
| Fiscal Year |
Number (YYYY) | This item represents the fiscal year of the current fiscal year-end month. | |||||||||
| Fiscal Quarter |
Roman Numeral | Current quarter (I, II, III, or IV) | |||||||||
| Period Number | Number | This item identifies quarters in the data set in the ascending order. | |||||||||
| Quarterly Revenue | Millions of US dollars | This item represents quarterly Sales/Turnover (Net) plus Operating Revenues. | |||||||||
| (Data obtained from Wharton Research Data Services (WRDS) – Compustat) |
Dummy
| Fiscal Year |
Fiscal Quarter | Period Number | Dummy_Quarter 1 | Dummy_Quarter 2 | Dummy_Quarter 3 | Dummy_Quarter 4 | Quarterly Revenue |
| 2000 | 1 | 1 | 1 | 0 | 0 | 0 | 573.889 |
| 2000 | 2 | 2 | 0 | 1 | 0 | 0 | 577.876 |
| 2000 | 3 | 3 | 0 | 0 | 1 | 0 | 637.858 |
| 2000 | 4 | 4 | 0 | 0 | 0 | 1 | 972.36 |
| 2001 | 1 | 5 | 1 | 0 | 0 | 0 | 700.356 |
| 2001 | 2 | 6 | 0 | 1 | 0 | 0 | 667.625 |
| 2001 | 3 | 7 | 0 | 0 | 1 | 0 | 639.281 |
| 2001 | 4 | 8 | 0 | 0 | 0 | 1 | 1115.171 |
| 2002 | 1 | 9 | 1 | 0 | 0 | 0 | 847.422 |
| 2002 | 2 | 10 | 0 | 1 | 0 | 0 | 805.605 |
| 2002 | 3 | 11 | 0 | 0 | 1 | 0 | 851.299 |
| 2002 | 4 | 12 | 0 | 0 | 0 | 1 | 1428.61 |
| 2003 | 1 | 13 | 1 | 0 | 0 | 0 | 1083.559 |
| 2003 | 2 | 14 | 0 | 1 | 0 | 0 | 1099.912 |
| 2003 | 3 | 15 | 0 | 0 | 1 | 0 | 1134.456 |
| 2003 | 4 | 16 | 0 | 0 | 0 | 1 | 1945.772 |
| 2004 | 1 | 17 | 1 | 0 | 0 | 0 | 1530.349 |
| 2004 | 2 | 18 | 0 | 1 | 0 | 0 | 1387.341 |
| 2004 | 3 | 19 | 0 | 0 | 1 | 0 | 1462.475 |
| 2004 | 4 | 20 | 0 | 0 | 0 | 1 | 2540.959 |
| 2005 | 1 | 21 | 1 | 0 | 0 | 0 | 1902 |
| 2005 | 2 | 22 | 0 | 1 | 0 | 0 | 1753 |
| 2005 | 3 | 23 | 0 | 0 | 1 | 0 | 1858 |
| 2005 | 4 | 24 | 0 | 0 | 0 | 1 | 2977 |
| 2006 | 1 | 25 | 1 | 0 | 0 | 0 | 2279 |
| 2006 | 2 | 26 | 0 | 1 | 0 | 0 | 2139 |
| 2006 | 3 | 27 | 0 | 0 | 1 | 0 | 2307 |
| 2006 | 4 | 28 | 0 | 0 | 0 | 1 | 3986 |
| 2007 | 1 | 29 | 1 | 0 | 0 | 0 | 3015 |
| 2007 | 2 | 30 | 0 | 1 | 0 | 0 | 2886 |
| 2007 | 3 | 31 | 0 | 0 | 1 | 0 | 3262 |
| 2007 | 4 | 32 | 0 | 0 | 0 | 1 | 5672 |
| 2008 | 1 | 33 | 1 | 0 | 0 | 0 | 4135 |
| 2008 | 2 | 34 | 0 | 1 | 0 | 0 | 4063 |
| 2008 | 3 | 35 | 0 | 0 | 1 | 0 | 4265 |
| 2008 | 4 | 36 | 0 | 0 | 0 | 1 | 6703 |
| 2009 | 1 | 37 | 1 | 0 | 0 | 0 | 4889 |
| 2009 | 2 | 38 | 0 | 1 | 0 | 0 | 4652 |
| 2009 | 3 | 39 | 0 | 0 | 1 | 0 | 5448 |
| 2009 | 4 | 40 | 0 | 0 | 0 | 1 | 9520 |
| 2010 | 1 | 41 | 1 | 0 | 0 | 0 | 7131 |
| 2010 | 2 | 42 | 0 | 1 | 0 | 0 | 6566 |
| 2010 | 3 | 43 | 0 | 0 | 1 | 0 | 7560 |
| 2010 | 4 | 44 | 0 | 0 | 0 | 1 | 12947 |
| 2011 | 1 | 45 | 1 | 0 | 0 | 0 | 9857 |
| 2011 | 2 | 46 | 0 | 1 | 0 | 0 | 9913 |
| 2011 | 3 | 47 | 0 | 0 | 1 | 0 | 10876 |
| 2011 | 4 | 48 | 0 | 0 | 0 | 1 | 17431 |
| 2012 | 1 | 49 | 1 | 0 | 0 | 0 | 13185 |
| 2012 | 2 | 50 | 0 | 1 | 0 | 0 | 12834 |
| 2012 | 3 | 51 | 0 | 0 | 1 | 0 | 13806 |
| 2012 | 4 | 52 | 0 | 0 | 0 | 1 | 21268 |
| 2013 | 1 | 53 | 1 | 0 | 0 | 0 | 16070 |
| 2013 | 2 | 54 | 0 | 1 | 0 | 0 | 15700 |
| 2013 | 3 | 55 | 0 | 0 | 1 | 0 | 17092 |
| 2013 | 4 | 56 | 0 | 0 | 0 | 1 | 25587 |
| 2014 | 1 | 57 | 1 | 0 | 0 | 0 | 19741 |
| 2014 | 2 | 58 | 0 | 1 | 0 | 0 | 19340 |
| 2014 | 3 | 59 | 0 | 0 | 1 | 0 | 20579 |
| 2014 | 4 | 60 | 0 | 0 | 0 | 1 | 29328 |
| 2015 | 1 | 61 | 1 | 0 | 0 | 0 | 22717 |
| 2015 | 2 | 62 | 0 | 1 | 0 | 0 | 23185 |
| 2015 | 3 | 63 | 0 | 0 | 1 | 0 | 25358 |
| 2015 | 4 | 64 | 0 | 0 | 0 | 1 | 35747 |
| 2016 | 1 | 65 | 1 | 0 | 0 | 0 | 29128 |
| 2016 | 2 | 66 | 0 | 1 | 0 | 0 | 30404 |
| 2016 | 3 | 67 | 0 | 0 | 1 | 0 | 32714 |
| 2016 | 4 | 68 | 0 | 0 | 0 | 1 | 43741 |
| 2017 | 1 | 69 | 1 | 0 | 0 | 0 | 35714 |
| 2017 | 2 | 70 | 0 | 1 | 0 | 0 | 37955 |
| 2017 | 3 | 71 | 0 | 0 | 1 | 0 | 43744 |
| 2017 | 4 | 72 | 0 | 0 | 0 | 1 | 60453 |
| 2018 | 1 | 73 | 1 | 0 | 0 | 0 | 51042 |
| 2018 | 2 | 74 | 0 | 1 | 0 | 0 | 52886 |
| 2018 | 3 | 75 | 0 | 0 | 1 | 0 | 56576 |
| 2018 | 4 | 76 | 0 | 0 | 0 | 1 | 72383 |
| SUMMARY OUTPUT | |||||||||
| Regression Statistics | |||||||||
| Multiple R | 0.873073370739425 | ||||||||
| R Square | 0.762257110694301 | ||||||||
| Adjusted R Square | 0.73477863805736 | ||||||||
| Standard Error | 8362.43723306973 | ||||||||
| Observations | 76 | ||||||||
| ANOVA | |||||||||
| df | SS | MS | F | Significance F | |||||
| Regression | 5 | 15919082694.7166 | 3183816538.94333 | 56.9104874359727 | 2.60663960093854E-23 | ||||
| Residual | 71 | 4965055309.8692 | 69930356.4770309 | ||||||
| Total | 76 | 20884138004.5858 | |||||||
| Coefficients | Standard Error | t Stat | P-value | Lower 95% | Upper 95% | Lower 95.0% | Upper 95.0% | ||
| Intercept | -12109.4611788377 | 2510.9461157477 | -4.8226686757202 | 7.82347402892733E-06 | -17116.1455333506 | -7102.77682432487 | -17116.1455333506 | -7102.77682432487 | |
| X Variable 1 | 648.108588048246 | 43.7829939739406 | 14.8027471221816 | 2.14741365706783E-23 | 560.807777589482 | 735.40939850701 | 560.807777589482 | 735.40939850701 | |
| X Variable 2 | 0 | 0 | 65535 | #NUM! | 0 | 0 | 0 | 0 | |
| X Variable 3 | -475.804166995609 | 2713.48615364779 | -0.175347925161135 | #NUM! | -5886.34188680255 | 4934.73355281133 | -5886.34188680255 | 4934.73355281133 | |
| X Variable 4 | 0.087771271934094 | 2714.54562638432 | 3.23336882169126E-05 | 0.999974292126615 | -5412.56247717143 | 5412.7380197153 | -5412.56247717143 | 5412.7380197153 | |
| X Variable 5 | 4908.58460427632 | 2716.31049597222 | 1.80707787697866 | 0.074986811553147 | -507.584694176949 | 10324.7539027296 | -507.584694176949 | 10324.7539027296 | |
Sheet 5
| SUMMARY OUTPUT | ||||||||
| Regression Statistics | ||||||||
| Multiple R | 0.996362640940462 | |||||||
| R Square | 0.992738512261852 | |||||||
| Adjusted R Square | 0.992634776722736 | |||||||
| Standard Error | 1445.47549907657 | |||||||
| Observations | 72 | |||||||
| ANOVA | ||||||||
| df | SS | MS | F | Significance F | ||||
| Regression | 1 | 19995338992.2251 | 19995338992.2251 | 9569.89784521116 | 1.30399158702332E-76 | |||
| Residual | 70 | 146257959.290146 | 2089399.41843066 | |||||
| Total | 71 | 20141596951.5152 | ||||||
| Coefficients | Standard Error | t Stat | P-value | Lower 95% | Upper 95% | Lower 99.0% | Upper 99.0% | |
| Intercept | 51.2693636888016 | 226.725653970228 | 0.226129521697328 | 0.821759668086777 | -400.920694780013 | 503.459422157616 | -549.078543781968 | 651.617271159572 |
| X Variable 1 | 1.2736741040695 | 0.013019810643585 | 97.8258546868422 | 1.30399158702332E-76 | 1.2477069105337 | 1.2996412976053 | 1.23919888726599 | 1.30814932087301 |
| Lower 99% CI | Upper 99% CI | |
| 62702.1110600485 | 67422.1749071598 | |
| Lower 95% | Upper 95% | |
| 63284.5354326811 | 66839.7505345272 |
Quarter
| Quarterly Revenue |
Independent variable |
| 573.889 | |
| 577.876 | |
| 637.858 | |
| 972.36 | |
| 700.356 | 573.889 |
| 667.625 | 577.876 |
| 639.281 | 637.858 |
| 1115.171 | 972.36 |
| 847.422 | 700.356 |
| 805.605 | 667.625 |
| 851.299 | 639.281 |
| 1428.61 | 1115.171 |
| 1083.559 | 847.422 |
| 1099.912 | 805.605 |
| 1134.456 | 851.299 |
| 1945.772 | 1428.61 |
| 1530.349 | 1083.559 |
| 1387.341 | 1099.912 |
| 1462.475 | 1134.456 |
| 2540.959 | 1945.772 |
| 1902 | 1530.349 |
| 1753 | 1387.341 |
| 1858 | 1462.475 |
| 2977 | 2540.959 |
| 2279 | 1902 |
| 2139 | 1753 |
| 2307 | 1858 |
| 3986 | 2977 |
| 3015 | 2279 |
| 2886 | 2139 |
| 3262 | 2307 |
| 5672 | 3986 |
| 4135 | 3015 |
| 4063 | 2886 |
| 4265 | 3262 |
| 6703 | 5672 |
| 4889 | 4135 |
| 4652 | 4063 |
| 5448 | 4265 |
| 9520 | 6703 |
| 7131 | 4889 |
| 6566 | 4652 |
| 7560 | 5448 |
| 12947 | 9520 |
| 9857 | 7131 |
| 9913 | 6566 |
| 10876 | 7560 |
| 17431 | 12947 |
| 13185 | 9857 |
| 12834 | 9913 |
| 13806 | 10876 |
| 21268 | 17431 |
| 16070 | 13185 |
| 15700 | 12834 |
| 17092 | 13806 |
| 25587 | 21268 |
| 19741 | 16070 |
| 19340 | 15700 |
| 20579 | 17092 |
| 29328 | 25587 |
| 22717 | 19741 |
| 23185 | 19340 |
| 25358 | 20579 |
| 35747 | 29328 |
| 29128 | 22717 |
| 30404 | 23185 |
| 32714 | 25358 |
| 43741 | 35747 |
| 35714 | 29128 |
| 37955 | 30404 |
| 43744 | 32714 |
| 60453 | 43741 |
| 51042 | 35714 |
| 52886 | 37955 |
| 56576 | 43744 |
| 72383 | 60453 |
| 51042 | |
| 52886 | |
| 56576 | |
| 72383 |
| SUMMARY OUTPUT | |||||||||
| Regression Statistics | |||||||||
| Multiple R | 0.996362640940462 | Required Value | 65062.1429836041 | ||||||
| R Square | 0.992738512261852 | ||||||||
| Adjusted R Square | 0.992634776722736 | ||||||||
| Standard Error | 1445.47549907657 | ||||||||
| Observations | 72 | ||||||||
| ANOVA | |||||||||
| df | SS | MS | F | Significance F | |||||
| Regression | 1 | 19995338992.2251 | 19995338992.2251 | 9569.89784521116 | 1.30399158702332E-76 | ||||
| Residual | 70 | 146257959.290146 | 2089399.41843066 | ||||||
| Total | 71 | 20141596951.5152 | |||||||
| Coefficients | Standard Error | t Stat | P-value | Lower 95% | Upper 95% | Lower 95.0% | Upper 95.0% | ||
| Intercept | 51.2693636888016 | 226.725653970228 | 0.226129521697328 | 0.821759668086777 | -400.920694780013 | 503.459422157616 | -400.920694780013 | 503.459422157616 | |
| X Variable 1 | 1.2736741040695 | 0.013019810643585 | 97.8258546868422 | 1.30399158702332E-76 | 1.2477069105337 | 1.2996412976053 | 1.2477069105337 | 1.2996412976053 | |
Looking for best Statistics Assignment Help. Whatsapp us at +16469488918 or chat with our chat representative showing on lower right corner or order from here. You can also take help from our Live Assignment helper for any exam or live assignment related assistance.