QUESTION
Need a distinction on my maths assignment, this is the website that I need to get the data from. www.OCED.org.uk something like (Smoking and lung cancer, Annual reported crime rates and Annual police crime or Hours worked and Household spending)
I need 50 lots of data for both in two separate tables of data in them and then show the data in the forms of: standard deviation (mean, median, mode and range), scatter graphs, box plots and cumulative frequency.
It needs to look professional with a cover sheet and including, (Introduction, hypothesis, data collection, data analysis, summary, conclusion and references) Each of these needs explain underneath how you done it and your outcome. Need to have some subheadings maybe put the sum/number in red so they stand out.
ANSWER
Smoking vs Death Due to Cancer
Contents
INTRODUCTION
HYPOTHESIS
DATA COLLECTION
Number of Smokers Data
NUMBER OF DEATHS DUE TO CANCER
DATA ANALYSIS
MEAN
MEDIAN
STANDARD DEVIATION
RANGE
CORRELATION
REGRESSION
CONCLUSION
INTRODUCTION
The following report tries to establish a correlation between the number of people who smoke and the number of people who die from cancer.
Smoking as we all are aware becomes a habit once a person starts getting used to it. It becomes an addiction because of the nicotine present in the tobacco. It has a lot of harmful effect and cancer is one of them. Cancer is a disease which happens because of abnormal growth in some body cells. It can happen in any part of the body. Smoking can primarily lead to lung cancer. Although with the advent of technology we have been able to cure this disease, but still large number of people die because of it.
Even today with large number of people dying because of cancer and smoking being one of its principal cause, and widely becoming a habit among the younger generation, makes it an interesting research topic.
HYPOTHESIS
Within the reach of my research I would like to prove that a relationship exists between the number of people who smoke regularly and those who die from cancer. For proving my hypothesis, I have gone for a secondary research methodology.
DATA COLLECTION
For proving my hypothesis, I have applied a secondary research methodology. This secondary data has been collected from the following website: www.OCED.org.uk. Two separate sets of data- Number of Smokers in the country (per 100000 person) and Number of deaths due to cancer (per 100000 person) were collected. For getting a proper and logical result, data of 41 countries were taken over the period of 2006-2016. The average of the 10-year data of each country was then taken for further analysis. The excel sheet attached would contain all the data which has been used in this research.
The following is the snapshot and average of the data which we have gathered and used for our research.
Number of Smokers Data
The data (average of 2006-2016 data) which has been shown below shows the number of people above 15 years of age who are addicted to smoking in these 41 countries.
|
Number of Smokers 15+ (2006-2016) per 100000 people |
|
|
LOCATION |
VALUE |
|
AUS |
14420 |
|
AUT |
23800 |
|
BEL |
19783 |
|
BRA |
12860 |
|
CAN |
15463 |
|
CHE |
20450 |
|
CHL |
27183 |
|
COL |
16833 |
|
CRI |
14422 |
|
CZE |
22133 |
|
DEU |
21500 |
|
DNK |
21556 |
|
ESP |
24950 |
|
EST |
25994 |
|
FIN |
18236 |
|
FRA |
24560 |
|
GBR |
19812 |
|
GRC |
34892 |
|
HUN |
26383 |
|
IND |
12478 |
|
IRL |
20444 |
|
ISL |
14379 |
|
ISR |
18389 |
|
ITA |
21924 |
|
JPN |
21436 |
|
KOR |
22020 |
|
LTU |
21167 |
|
LUX |
17697 |
|
LVA |
26917 |
|
MEX |
10206 |
|
NLD |
20855 |
|
NOR |
17545 |
|
NZL |
16529 |
|
POL |
23550 |
|
PRT |
18000 |
|
RUS |
36317 |
|
SVK |
21367 |
|
SVN |
18917 |
|
SWE |
12894 |
|
TUR |
27444 |
|
USA |
14439 |
|
ZAF |
19667 |
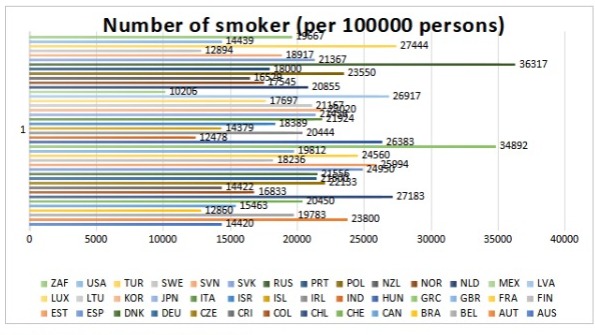
Graphically it could be presented as:
NUMBER OF DEATHS DUE TO CANCER
The data (average of 2006-2016 data) which has been shown below shows the number of people above 15 years of age who are dying because of cancer in these 41 countries.
|
LOCATION |
VALUE |
|
AUS |
203.04 |
|
AUT |
208.84 |
|
BEL |
219.30 |
|
BRA |
164.25 |
|
CAN |
217.80 |
|
CHE |
188.50 |
|
CHL |
206.45 |
|
COL |
166.91 |
|
CRI |
169.72 |
|
CZE |
251.66 |
|
DEU |
211.92 |
|
DNK |
253.77 |
|
ESP |
203.04 |
|
EST |
258.75 |
|
FIN |
185.12 |
|
FRA |
215.29 |
|
GBR |
231.88 |
|
GRC |
205.95 |
|
HUN |
302.66 |
|
IRL |
240.37 |
|
ISL |
209.84 |
|
ISR |
189.73 |
|
ITA |
213.95 |
|
JPN |
192.31 |
|
KOR |
202.20 |
|
LTU |
251.32 |
|
LUX |
211.37 |
|
LVA |
266.20 |
|
MEX |
121.35 |
|
NLD |
241.73 |
|
NOR |
212.74 |
|
NZL |
222.25 |
|
POL |
258.98 |
|
PRT |
205.41 |
|
RUS |
227.60 |
|
SVK |
267.11 |
|
SVN |
264.65 |
|
SWE |
194.27 |
|
TUR |
163.30 |
|
USA |
201.03 |
|
ZAF |
198.03 |
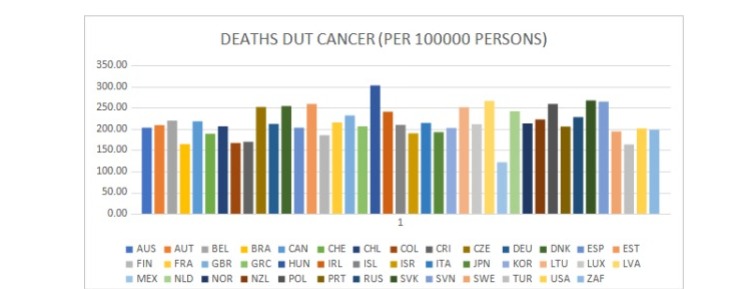
Graphically it could be presented as:
DATA ANALYSIS
The following statistical analysis was even carried on this data which have been explained below
MEAN
Mean tells you the average number of people in these 41 countries per 100000 person who are addicted to smoking. All calculations have been shown in the above excel sheet. For the above data the mean comes out to be 20472 people which approximately means 20.47% of the population on average are smokers.
Similarly, from the second set of data we see that the mean comes out to be 215.14 which approximately means 0.215% of the population on average die from cancer.
MEDIAN
Median gives us a true picture about the data than the mean as it is the middle value of the data. In the above data the median comes out to be 20447 people which approximately means 20.44% of the population on average are smokers.
Similarly, from the second set of data we observe that the median comes out to be 211.37 which approximately means 0.211% of the population on average die from cancer.
STANDARD DEVIATION
Standard Deviation is one of the commonly used statistical tool and provides a great understanding of the data. It helps in understanding the dispersion in the data. Standard deviation of this data is 5512, which implies that the values in the data are very far from each other. This implies that in some countries the number of smokers is more as compared to other countries.
From the data on deaths due to cancer we see that the standard deviation comes out to be 34.72 which implies that the data value of deaths due to cancer in most countries is quite close to each other.
RANGE
The range gives us the difference between the highest and lower values in the data. The larger the range value tells us that the data is spread through a wide region. From the first set of data the range value comes out to be 23839, which is a huge value.
From the second set of data we get the range to be 145, which is fairly a low value. Thus, the data is very congested together in this case.
CORRELATION
In statistics, correlation is a technique which helps us to understand the relationship or dependence of one variable with another variable. In this number of smokers is one variable and deaths due to cancer is the other variable. A correlation test led to the following result:
|
|
Smokers |
Deaths |
| Smokers |
1 |
0.413215 |
| Deaths |
0.413215 |
1 |
This test helps us in understanding that there seems to be a linear relationship between both the variables: number of smokers and deaths due to cancer. A correlation of .413 implies that as the number of smokers increase, the death due to cancer will also increase and vice versa.
REGRESSION
In statistics regression analysis is the most commonly used technique in understanding the association between the data variables. For regression analysis, there is one data which is dependent and the other is said to be independent. So here we have assumed the number of smoker data to be independent and the deaths due to cancer to be a dependant variable. The following results got displayed with the above assumptions.
|
SUMMARY OUTPUT |
||||||||
|
Regression Statistics |
||||||||
| Multiple R |
0.413215147 |
|||||||
| R Square |
0.170746757 |
|||||||
| Adjusted R Square |
0.149483854 |
|||||||
| Standard Error |
32.0180677 |
|||||||
| Observations |
41 |
|||||||
| ANOVA | ||||||||
|
|
df |
SS |
MS |
F |
Significance F |
|||
| Regression |
1 |
8232.279948 |
8232.279948 |
8.030265299 |
0.007248193 |
|||
| Residual |
39 |
39981.10971 |
1025.156659 |
|||||
| Total |
40 |
48213.38966 |
||||||
|
|
Coefficients |
Standard Error |
t Stat |
P-value |
Lower 95% |
Upper 95% |
Lower 95.0% |
Upper 95.0% |
| Intercept |
160.6487338 |
19.86762485 |
8.085955669 |
7.27106E-10 |
120.4626694 |
200.8347982 |
120.4626694 |
200.8347982 |
| X Variable 1 |
0.002636511 |
0.000930389 |
2.833772274 |
0.007248193 |
0.000754621 |
0.0045184 |
0.000754621 |
0.0045184 |
The following line plot was also observed:
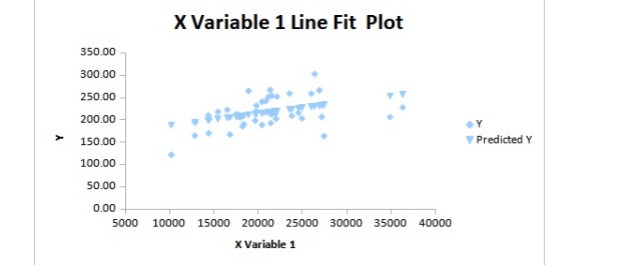
From the above result we observe that R square value comes out to be 0.17 which is a very small number which tells us that the actual data is very far from the regression line. This small value indicated a weak relationship between the two variables. Although this may not be true because regression has its own set of limitations.
CONCLUSION
From the results of the different statistical tools it has been very hard to establish that a strong correlation exists between the above two data. Since data has been collected from a secondary source there can some data issues as well. So, data collection has also been one of the limitations of this research. Even the statistical methods which have been employed all suffer from their own respective limitations.
The data that has been taken has a lot of variation because of which it has been very hard to prove our above hypothesis. Although we observed that there exists a positive correlation between the two data sets but still the R square value was very less which forces us to negate our hypothesis. So, we can conclude that although smoking is a bad habit but there is only a small percentage of people who are dying because of it.
Looking for best Research Assignment Help. Whatsapp us at +16469488918 or chat with our chat representative showing on lower right corner or order from here. You can also take help from our Live Assignment helper for any exam or live assignment related assistance.