QUESTION
Please answer the following questions based on the SPSS analyses provided.
1. A correlation analysis was conducted with 10 survey questions from the Schwarzenegger survey (q1 through q10), producing the following results:
Descriptive Statistics
|
|
Mean |
Std. Deviation |
N |
|
q1 |
2.66 |
1.529 |
496 |
|
q30 |
1.44 |
1.034 |
473 |
|
q32 |
1.95 |
1.372 |
470 |
|
q47 |
1.38 |
4.754 |
462 |
|
q52 |
4.04 |
.932 |
464 |
|
q53 |
2.06 |
.785 |
461 |
Correlations
|
|
|
q1 |
q30 |
q32 |
q47 |
q52 |
q53 |
|||||||
|
q1 |
Pearson Correlation |
1 |
.492(**) |
.354(**) |
.127(**) |
-.067 |
-.531(**) |
|||||||
|
|
Sig. (2-tailed) |
|
.000 |
.000 |
.006 |
.153 |
.000 |
|||||||
|
|
N |
496 |
471 |
468 |
461 |
462 |
459 |
|||||||
|
q30 |
Pearson Correlation |
.492(**) |
1 |
.530(**) |
.281(**) |
-.176(**) |
-.217(**) |
|||||||
|
|
Sig. (2-tailed) |
.000 |
|
.000 |
.000 |
.000 |
.000 |
|||||||
|
|
N |
471 |
473 |
463 |
450 |
453 |
449 |
|||||||
|
q32 |
Pearson Correlation |
.354(**) |
.530(**) |
1 |
.186(**) |
-.126(**) |
-.112(*) |
|||||||
|
|
Sig. (2-tailed) |
.000 |
.000 |
|
.000 |
.007 |
.017 |
|||||||
|
|
N |
468 |
463 |
470 |
450 |
454 |
450 |
|||||||
|
q47 |
Pearson Correlation |
.127(**) |
.281(**) |
.186(**) |
1 |
-.111(*) |
-.061 |
|||||||
|
|
Sig. (2-tailed) |
.006 |
.000 |
.000 |
|
.019 |
.196 |
|||||||
|
|
N |
461 |
450 |
450 |
462 |
447 |
445 |
|||||||
|
q52 |
Pearson Correlation |
-.067 |
-.176(**) |
-.126(**) |
-.111(*) |
1 |
.036 |
|||||||
|
|
Sig. (2-tailed) |
.153 |
.000 |
.007 |
.019 |
|
.447 |
|||||||
|
|
N |
462 |
453 |
454 |
447 |
464 |
457 |
|||||||
|
q53 |
Pearson Correlation |
-.531(**) |
-.217(**) |
-.112(*) |
-.061 |
.036 |
1 |
|||||||
|
|
Sig. (2-tailed) |
.000 |
.000 |
.017 |
.196 |
.447 |
|
|||||||
|
|
N |
459 |
449 |
450 |
445 |
457 |
461 |
|||||||
** Correlation is significant at the 0.01 level (2-tailed).
* Correlation is significant at the 0.05 level (2-tailed).
1. Questions to answer (5 pts)
-
What two variables have the smallest linear association?
-
What is the relationship between q47 and q52?
-
Is the correlation between q1 and q52 significant?
-
What is the strongest association?
-
Is the sample size adequate to test hypotheses with these survey items?
2. A simple regression analysis produced the following results:
Descriptive Statistics
|
|
Mean |
Std. Deviation |
N |
|
q16 |
2.27 |
1.420 |
479 |
|
q3 |
1.92 |
1.270 |
479 |
Correlations
|
|
|
q16 |
q3 |
|||
|
Pearson Correlation |
q16 |
1.000 |
.720 |
|||
|
|
q3 |
.720 |
1.000 |
|||
|
Sig. (1-tailed) |
q16 |
. |
.000 |
|||
|
|
q3 |
.000 |
. |
|||
|
N |
q16 |
479 |
479 |
|||
|
|
q3 |
479 |
479 |
|||
-
Questions to answer (5 pts)
-
Is this regression model significant? Which statistic indicates this?
-
Is the amount of variance explained by this regression model larger or smaller than the unexplained variance? How do you know?
-
Does this result support the following hypothesis? How do you know?
H1: Modeling the behavior of Schwarzenegger (q3) will be positively associated with
increasing personal fitness habits (q16).
-
Is q3 a significant predictor of q16? How do you know?
-
Please write the unstandardized regression equation for this analysis below
ANSWER
Please answer the following questions based on the SPSS analyses provided.
1. A correlation analysis was conducted with 10 survey questions from the Schwarzenegger survey (q1 through q10), producing the following results:
Descriptive Statistics
|
|
Mean |
Std. Deviation |
N |
|
q1 |
2.66 |
1.529 |
496 |
|
q30 |
1.44 |
1.034 |
473 |
|
q32 |
1.95 |
1.372 |
470 |
|
q47 |
1.38 |
4.754 |
462 |
|
q52 |
4.04 |
.932 |
464 |
|
q53 |
2.06 |
.785 |
461 |
Correlations
|
|
|
q1 |
q30 |
q32 |
q47 |
q52 |
q53 |
|||||||
|
q1 |
Pearson Correlation |
1 |
.492(**) |
.354(**) |
.127(**) |
-.067 |
-.531(**) |
|||||||
|
|
Sig. (2-tailed) |
|
.000 |
.000 |
.006 |
.153 |
.000 |
|||||||
|
|
N |
496 |
471 |
468 |
461 |
462 |
459 |
|||||||
|
q30 |
Pearson Correlation |
.492(**) |
1 |
.530(**) |
.281(**) |
-.176(**) |
-.217(**) |
|||||||
|
|
Sig. (2-tailed) |
.000 |
|
.000 |
.000 |
.000 |
.000 |
|||||||
|
|
N |
471 |
473 |
463 |
450 |
453 |
449 |
|||||||
|
q32 |
Pearson Correlation |
.354(**) |
.530(**) |
1 |
.186(**) |
-.126(**) |
-.112(*) |
|||||||
|
|
Sig. (2-tailed) |
.000 |
.000 |
|
.000 |
.007 |
.017 |
|||||||
|
|
N |
468 |
463 |
470 |
450 |
454 |
450 |
|||||||
|
q47 |
Pearson Correlation |
.127(**) |
.281(**) |
.186(**) |
1 |
-.111(*) |
-.061 |
|||||||
|
|
Sig. (2-tailed) |
.006 |
.000 |
.000 |
|
.019 |
.196 |
|||||||
|
|
N |
461 |
450 |
450 |
462 |
447 |
445 |
|||||||
|
q52 |
Pearson Correlation |
-.067 |
-.176(**) |
-.126(**) |
-.111(*) |
1 |
.036 |
|||||||
|
|
Sig. (2-tailed) |
.153 |
.000 |
.007 |
.019 |
|
.447 |
|||||||
|
|
N |
462 |
453 |
454 |
447 |
464 |
457 |
|||||||
|
q53 |
Pearson Correlation |
-.531(**) |
-.217(**) |
-.112(*) |
-.061 |
.036 |
1 |
|||||||
|
|
Sig. (2-tailed) |
.000 |
.000 |
.017 |
.196 |
.447 |
|
|||||||
|
|
N |
459 |
449 |
450 |
445 |
457 |
461 |
|||||||
** Correlation is significant at the 0.01 level (2-tailed).
* Correlation is significant at the 0.05 level (2-tailed).
1. Questions to answer
-
What two variables have the smallest linear association?
Ans. Q53 and q52 – Correlation value is .036
-
What is the relationship between q47 and q52?
Ans. Correlation value is -0.111 which is significant at 5%. It means that they have weak negative linear correlation.
-
Is the correlation between q1 and q52 significant?
Ans. No, since the sig. value is very high.
-
What is the strongest association?
Ans. Strongest correlation is between q1 and q53, also it is highly significant.
-
Is the sample size adequate to test hypotheses with these survey items?
Ans. Yes, any number greater than 30 is adequate.
2. A simple regression analysis produced the following results:
Descriptive Statistics
|
|
Mean |
Std. Deviation |
N |
|
q16 |
2.27 |
1.420 |
479 |
|
q3 |
1.92 |
1.270 |
479 |
Correlations
|
|
|
q16 |
q3 |
|||
|
Pearson Correlation |
q16 |
1.000 |
.720 |
|||
|
|
q3 |
.720 |
1.000 |
|||
|
Sig. (1-tailed) |
q16 |
. |
.000 |
|||
|
|
q3 |
.000 |
. |
|||
|
N |
q16 |
479 |
479 |
|||
|
|
q3 |
479 |
479 |
|||
-
Questions to answer (5 pts)
-
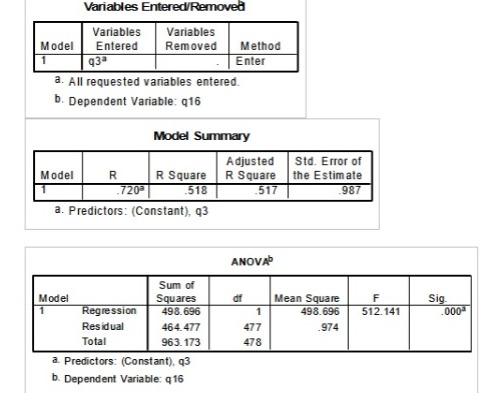
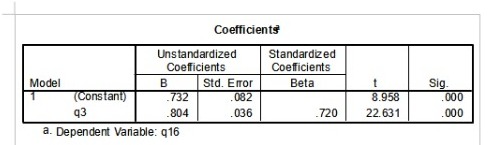
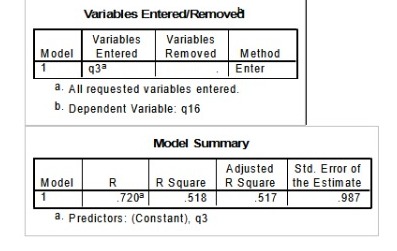
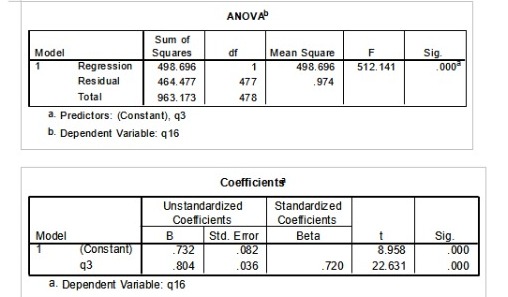
Is this regression model significant? Which statistic indicates this?
Ans. Yes, this model is significant. Sig. value in Anova table tells this.
-
Is the amount of variance explained by this regression model larger or smaller than the unexplained variance? How do you know?
Ans. Amount of variance explained is given by adjusted R square, which is just above 50%. Amount of variance explained is larger than unexplained.
-
Does this result support the following hypothesis? How do you know?
H1: Modeling the behavior of Schwarzenegger (q3) will be positively associated with
increasing personal fitness habits (q16).
Ans. Yes, because the coefficient of q3 is positive.
-
Is q3 a significant predictor of q16? How do you know?
Ans. Yes, as shown by the Sig. value in Coefficients table
-
Please write the unstandardized regression equation for this analysis below:
Q16 = 0.732 + 0.804*(q3)
Looking for Statistics Assignment Help. Whatsapp us at +16469488918 or chat with our chat representative showing on lower right corner or order from here. You can also take help from our Live Assignment helper for any exam or live assignment related assistance.