QUESTION
2000 Words Statistical Analysis on Solos Science and Engineering Company Ltd
Region : Taiwan
ANSWER
Solos Science and Engineering Company Ltd
Overview
Founded in 1985, Solas Science & Engineering Co., Ltd. [1] is a Taiwan based company that pioneers in manufacturing maritime products. The major product line of the company includes the impellers for the personal watercrafts and such vehicles, stern drive propellers and onboard drive propellers. The company is known for its propellers and casting equipment. Apart from the above-mentioned industrial grade equipment the company also makes impellers, intake grates, propulsion parts made from PWC, jet pumps for motor boats, propellers made of stainless steel, propellers made of aluminium, accessories for impellers, accessories for propellers, products for rubber bushing and even propellers for ski [2]. The companies ships its products to all the six continents in Africa, Asia, Europe, North America, South America, and Oceania and one could visit their online website www.solas.com to purchase the products online as well.
The company takes advantage of advanced technology and low-cost sourcing to achieve its lower price points. Safety has always been of prime importance to the company. As the company has a wide range of product portfolio it is able to meet the needs of almost all its customers. In the rare case of a special request the company has always been accommodating in its product designs to make customised products as well.
Above all the product quality has been the prime reason it has been able to satisfy its customers till now and continues to prosper. It has implemented techniques like total quality management and just in time inventory system to lower its costs and provide superior quality output. All the manufacturing processes like casting, machining , the actual material handling and the final production and packaging of the finished product are handled by technology [3].
The company lays a lot of emphasis on superior design and craftsmanship in its products and that is the differentiating factor for the company among the competitive market it operates in. The company is committed to the principle of working for the welfare of the mankind by applying the principles of theory to make practical working designs in reality. The core faith of the company lies in the following 8 core values of innovation, excellence, value, perpetuation, contribution, progress, honesty and harmony.
Most of the production by the company in in Taiwan itself and a part of that is outsourced to China [4]. The company ships through its centre in Taiwan itself however it is able to cater to all the centres around the globe. The company has large spending in its core unit in Research and Development.
Network
Figure 1 shows the basic network of the company with no filters and formatting applied. An overview od the design of the network shows that the company is divided in a wide number of small segments which are not always directly linked. We are able to make out standalone segment with Solas Science & Engineering Co., Ltd visible just below the centre of the diagram. Other nodes who have their names visible are the major nodes which had large number of edges moving towards or away from them. We can see that the company has a close relation/dependence on companies like Tata gas and power ventures which it depends on for its power/energy needs. Other two major nodes in the initial analysis turned out to be The Regents of the University of California and JX Nippon Oil and energy Corporation.
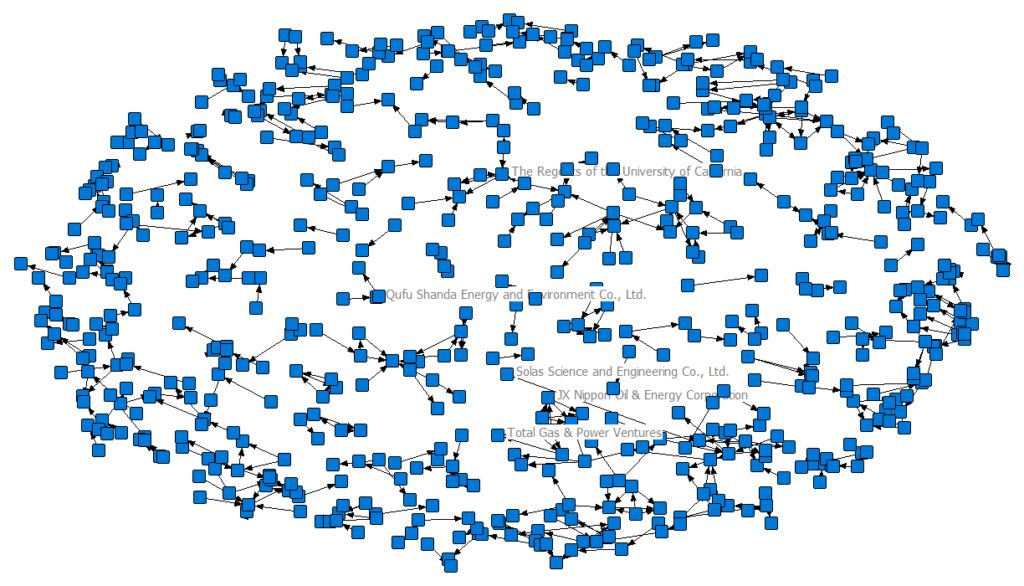
Figure 1: Basic Company network
The natural next step in the analysis was to understand how the components of the company were distributed to see the difference in how these clusters worked and if there was any connection between these clusters in terms of the edge which was not visible in the initial analysis.
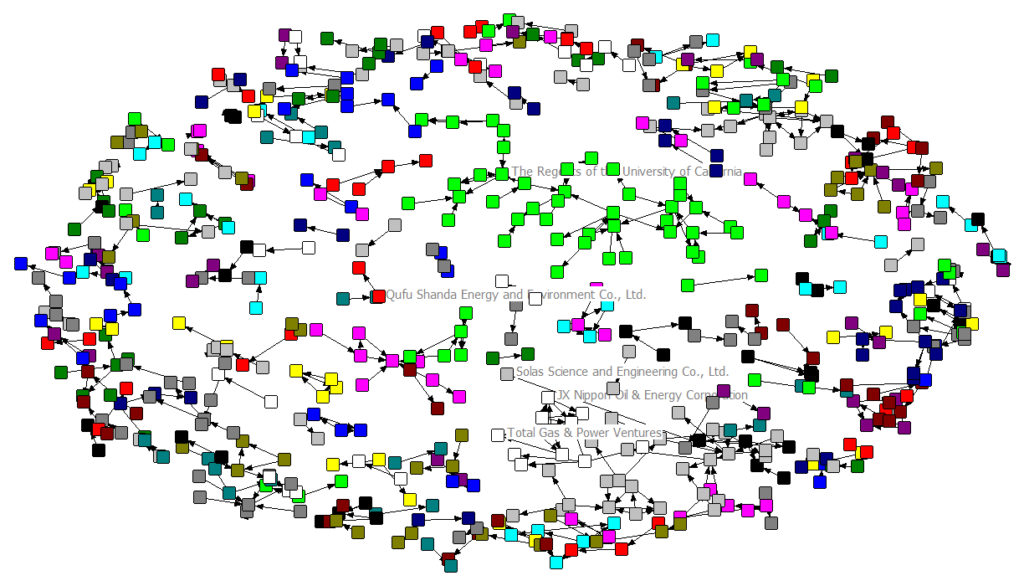
Figure 2: 221 components of the company
Figure 2 above shows the component analysis of the company. There are a total of 221 components in the company and there is a wide distribution with only a few centre/pivotal points. There size of the components also seems to vary largely with a few components as small as two components and the larger ones having more than forty nodes. Solas Science & Engineering Co., Ltd is not the part of the largest component which shows that the distribution system is far wide and well spread and the company operated centrally with a small size in the centre and distributing majority of the work in terms of operational entities to other segments. We can also see that many small components are interacting with each other and there are clusters of multiple components in a small space. From here we move forward to see if Solas Science & Engineering Co., Ltd is part of the largest central component or does that remain with another entity in the network.
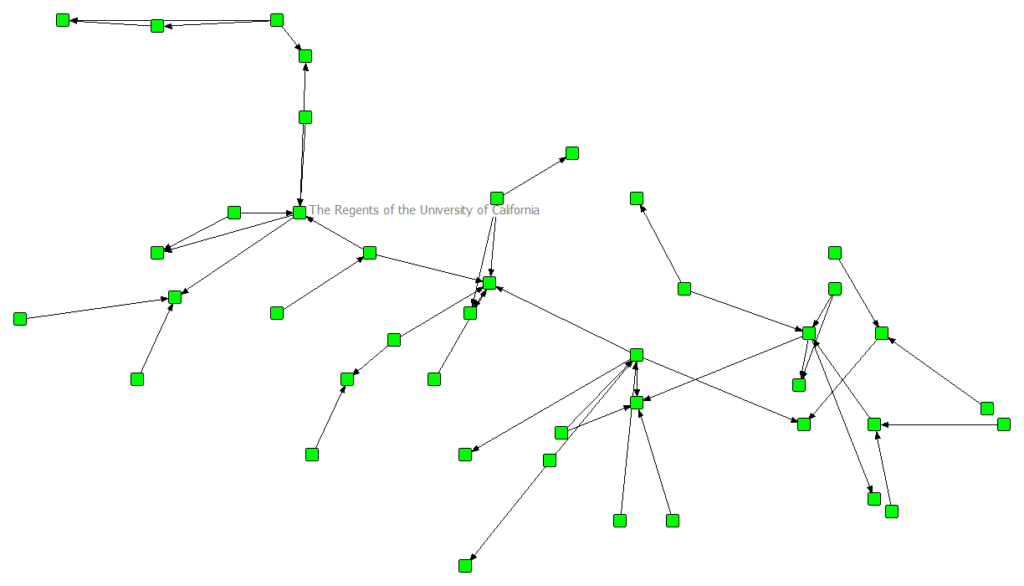
Figure 3: Largest component
Figure 3 shows the largest component by size which does not have Solas in it. Rather the actual company was part of the third largest component and had 36 nodes in the component whereas the above component has 42 nodes in it. The component is USA based and has a lot of central hubs. This resembles closely to a distribution channel and as a matter of fact the diagram shows one of the distribution systems of the company in USA.
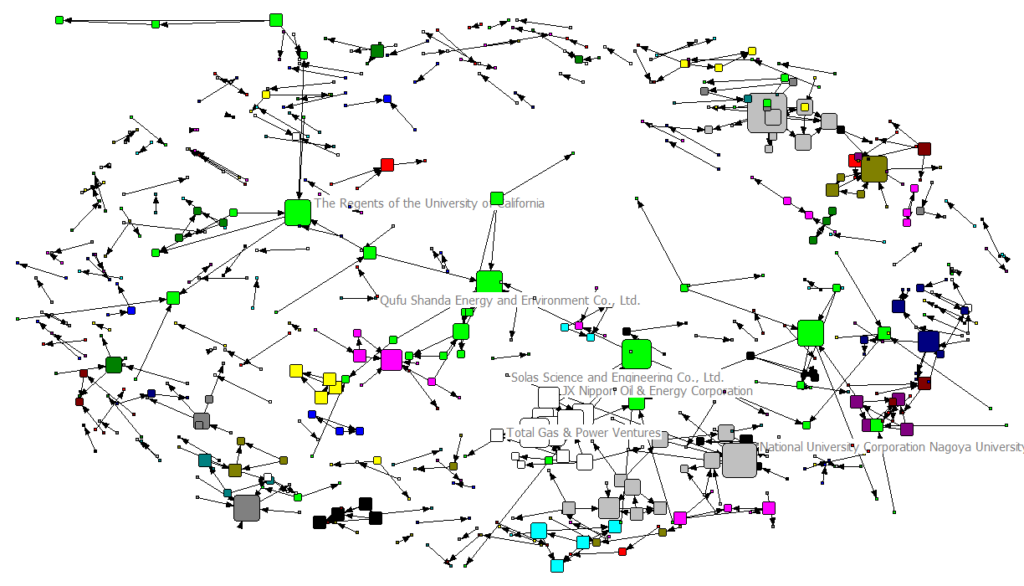
Figure 4: Component analysis with degree
However, at this juncture the centrality of the components became a point of consideration to understand how the company is centralised. Thus, over the colours of the components an analysis of the centrality was superimposed to understand how the company network is distributed.
Figure 4 shows the centrality analysis along with the component analysis of the company. The size of the nodes is based on the degree of each node. The relative size of the nodes in their respective components shows the importance of the nodes. We can see that in terms of degree Solas itself does not have a large size and rather it has one of the least degrees among all the nodes the actual distribution of the network is via different nodes which work with Solas and the company’s main unit itself is not responsible for the major operations. Solas itself links to one of the largest nodes showing one of the highest degrees. There are multiple large nodes in some components pointing to multiple hub and spoke structure.
Thus, the above diagrams shows that the company is highly segmented into different clusters with many centres in its components. The size of the large components is relatively close and there is no exceptionally large component in the company. Which points to the fact that the components might be self-sustaining independent components which take care of the regional operations for the company.
Analysis
We further move to analyse the actual output metrics of the company with reference to the centrality measures of the company. The most basic analysis begins by the k-core analysis superimposed on the country codes of the nodes.
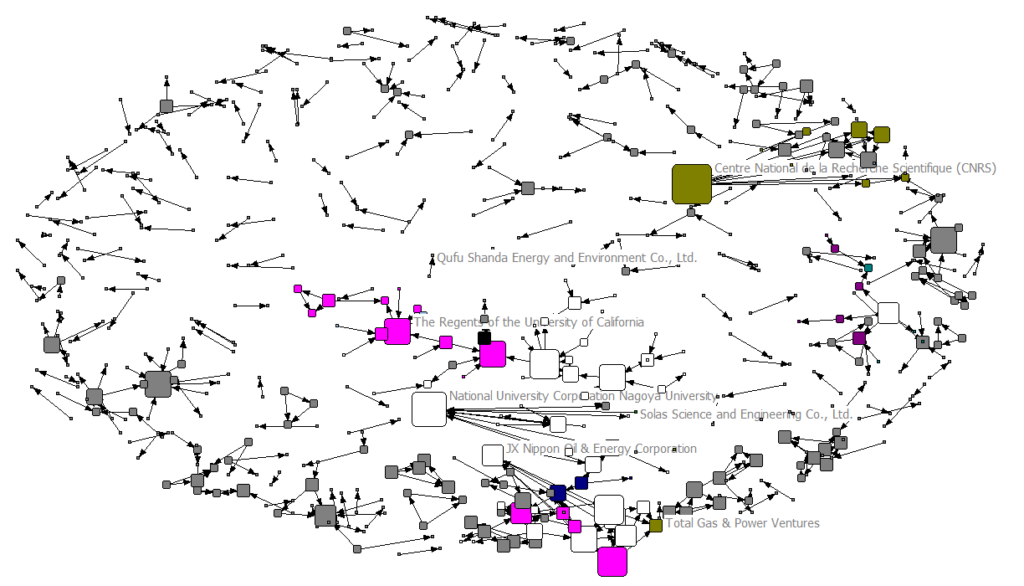
Figure 5: k-core analysis with country codes
Figure 5 shows the country codes of the different nodes represented by different colours. The colour grey represents missing data. The size of the nodes depends on the k-core analysis. We can see that the company has a distribution in multiple countries and when the figure is seen in parallel with the component analysis shown above in figure 2 and 4, we can see that the initial proposition of centres in different countries was correct as the country codes almost separates the nodes like the component analysis separated. CRNS is part of the core with value 6. Solas is part of the second largest core segment and represents the colour for Taiwan. From the countries we move forward to the employees of the company.
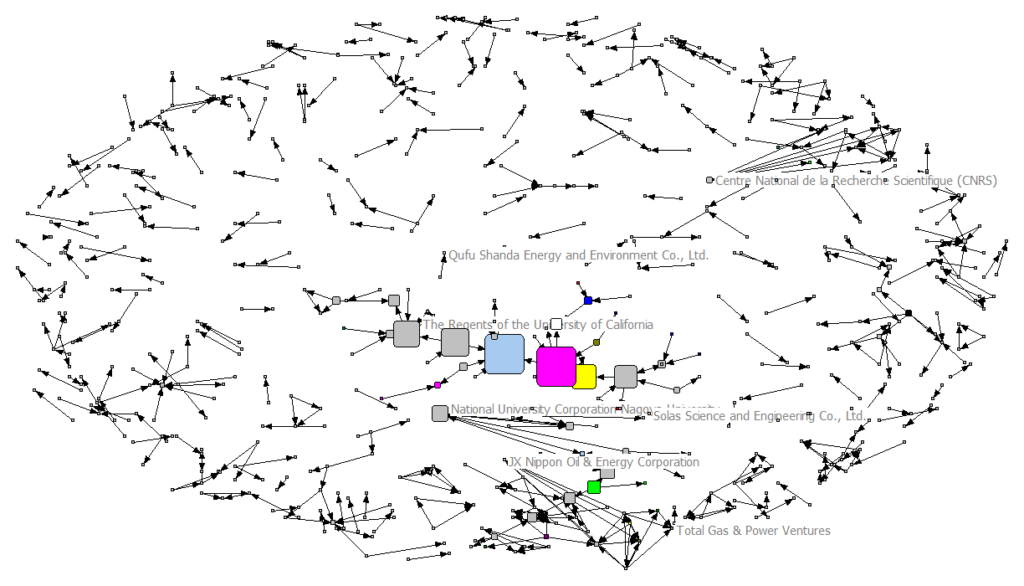
Figure 6: Total Employees with betweenness
Figure size shows the total employee data viz a vis the betweenness of the nodes of the company. As Solas is the ape node we can see that the betweenness of the node is the lowest which is represented by the size of the node. The employee data is represented by the colour of the nodes. The emphasis of the diagram is more on the betweenness of the nodes to show that the betweenness of the nodes is generally very low and shows that most of the nodes no not largely interact with many nodes. We can see that the nodes with higher betweenness have a large number of employees for the company. The Regents of University of California also has a high betweenness. The same component has large employee density for the company as well. From employee data we move forward to the total assets for the company keeping the betweenness data constant.
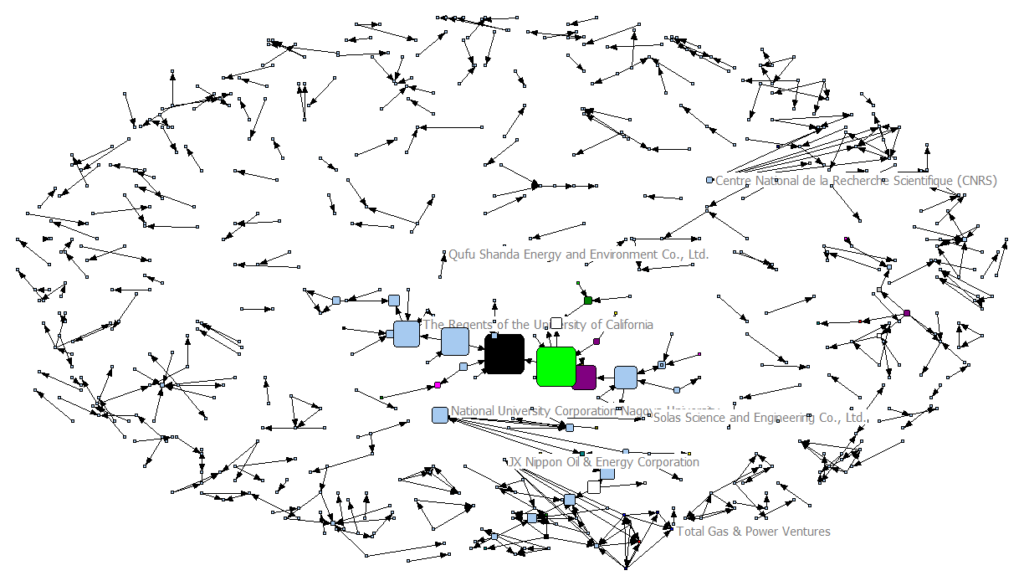
Figure 7: Total assets and betweenness
Figure 7 shows the total assets of the attributes of the nodes against different colours whereas the betweenness of the nodes is still represented by the size of the nodes. We can see from figure 6 and figure 7 that the total assets and the employees have a high correlation and the number of employees for a node is related to the total asset data for the node. The nodes coloured in cyan did not have any total asset data available for them and hence the result for them cannot be interpreted.
However, at this point we can see that the company truly works like a product company with the main company truly just a shell and a brand name which sells all the products. But the actual operation and distribution is distributed throughout the network with the employees working in different countries as well and similarly the assets of the company do not just lie in Taiwan but also in other continents where they have distribution of their products.
Implications of Innovation Strategy
The industry in which the company operates is a highly competitive industry and the product margins decrease in the industry as the competitiveness of the industry increase. We can see that the distribution of Solas Science & Engineering Co., Ltd. is distributed in multiple components and hence in multiple countries. Hence the country environment will be the largest impacting factor on the company. It already spends a high amount on research and development of its products and the quality of the products is of prime importance to the company. Thus, the industry environment will not be an impacting factor on the innovation strategy of the company as it remains the market leader in design and quality [5]. Only a disruptive innovation can impact the company.
On the other hand, the country environment will be an impacting factor for every aspect of the company. The contingencies for the innovative strategy begin from the tax implications for its products where the products will see a raise in the cost for the buyers as international tax and customs are applied on the products as they cross international borders [6]. Th same will be escalated further in some countries over others based on the differential taxes that each country applies.
Several countries provide discount and subsidies to the producers that develop the products domestically which will have huge implications on the innovation strategy. The amount invested in research and development can quickly turn into sunk cost if the local domestic product in a country is so much below the price of Solas products that the customer chooses an inferior product over the superior products [7]. A similar impact can be predicted over the material of use for multiple products where the customers in different countries have different choice of materials which should be used in casting the final products. The preference can range from completely shifting from stainless steel to aluminium to the difference in the grade of steel used for the cast.
Thus, the country risk has a huge premium for the innovative strategy of the company compared to the industry risk and Solas Science & Engineering Co., Ltd. should have a plan for tackling the country risk. The same is escalated even higher due to the large market that the company serves in.
REFERENCES
- SOLAS Science & Engineering Co Ltd Files Patent Application for Electric Outboard Drive 2013, , Athena Information Solutions Pvt. Ltd, New Delhi.
- Puisa, R., Tsakalakis, N., Vassalos, D. & Tuzcu, C. 2013, “A critical look at SOLAS CH II-1 with respect to floodable length of compartments in RoPax ships”, Journal of Marine Science and Technology (Japan), vol. 18, no. 1, pp. 50-62.
- Brooks, I.M., Yelland, M.J., Upstill-Goddard, R.C., Nightingale, P.D., Archer, S., d’Asaro, E., Beale, R., Beatty, C., Blomquist, B., Bloom, A.A., Brooks, B.J., Cluderay, J., Coles, D., Dacey, J., DeGrandpr̈e, M., Dixon, J., Drennan, W.M., Gabriele, J., Goldson, L., Hardman-Mountford, N., Hill, M.K., Horn, M., Hsueh, P., Huebert, B., De Leeuw, G., Leighton, T.G., Liddicoat, M., Lingard, J.J.N., McNeil, C., McQuaid, J.B., Moat, B.I., Moore, G., Neill, C., Norris, S.J., O’Doherty, S., Pascal, R.W., Prytherch, J., Rebozo, M., Sahlee, E., Salter, M., Schuster, U., Skjelvan, I., Slagter, H., Smith, M.H., Smith, P.D., Srokosz, M., Stephens, J.A., Taylor, P.K., Telszewski, M., Walsh, R., Ward, B., Woolf, D.K., Young, D. & Zemmelink, H. 2009, “Physical exchanges at the air-sea interface: UK-SOLAS field measurements”, Bulletin of the American Meteorological Society, vol. 90, no. 5, pp. 629-644.
- Crowley, J., director, e. & National Association of Waterfront 2016, Don’t delay SOLAS implementation, IHS Maritime & Trade, New York.
- Pawłowski, M. 2017, “Critical review of subdivision regulations in the SOLAS convention”, Journal of Ship Production and Design, vol. 33, no. 4, pp. 342-356.
- Law, C.S., Brévière, E., De Leeuw, G., Garçon, V., Guieu, C., Kieber, D.J., Kontradowitz, S., Paulmier, A., Quinn, P.K., Saltzman, E.S., Stefels, J. & Von Glasow, R. 2013, “Evolving research directions in Surface Ocean-Lower Atmosphere (SOLAS) science”, Environmental Chemistry, vol. 10, no. 1, pp. 1-16.
- Harvey, M.J., Law, C.S., Smith, M.J., Hall, J.A., Abraham, E.R., Stevens, C.L., Hadfield, M.G., Ho, D.T., Ward, B., Archer, S.D., Cainey, J.M., Currie, K.I., Devries, D., Ellwood, M.J., Hill, P., Jones, G.B., Katz, D., Kuparinen, J., Macaskill, B., Main, W., Marriner, A., McGregor, J., McNeil, C., Minnett, P.J., Nodder, S.D., Peloquin, J., Pickmere, S., Pinkerton, M.H., Safi, K.A., Thompson, R., Walkington, M., Wright, S.W. & Ziolkowski, L.A. 2011, “The SOLAS air-sea gas exchange experiment (SAGE) 2004”, Deep-Sea Research Part II: Topical Studies in Oceanography, vol. 58, no. 6, pp. 753-763.
Looking for best Research Assignment Help. Whatsapp us at +16469488918 or chat with our chat representative showing on lower right corner or order from here. You can also take help from our Live Assignment helper for any exam or live assignment related assistance.