QUESTION
Write a 2000 Words Statistical Analysis on the Topic Tokyo Institute of Technology
Country :: Japan
ANSWER
Tokyo Institute of Technology
Table of Contents
Introduction
Main Strategy of the Organization
Analysis of Parent-Subsidiary network using NetDraw
Figure 1: Country Code
Figure 2: Closeness
Figure 3: Betweenness
Figure 4: Country Code with Degree
Figure 5: Country Code with Eigen Vector
Figure 6: Country Code with Patent Counts
Figure 7: Country Code with University
Figure 8: Country Code with Employees
Figure 9: Country Code with Turnover Lay
Suggestions for Improvement and Performance Implications
Conclusion
References
Introduction
Tokyo Institute of Technology (also known as Tokyo Tech) is the largest institution for higher level education (graduation and post-graduation) in Japan. It is a national research university, which was founded back in 1881 by the government of Japan. It was opened by government with an aim to catch up to the west by cultivating new modernized craftsmen and engineers. It has been renamed several times since then. Located in the capital of Japan, it is considered as one of the most prestigious universities of the country. It comes under the consumer discretionary sector and consumer services industry, with its sub-industry as Educational services. It is one of the famous educational institution hubs for supercomputing technology and condensed matter research. It has three campuses in Japan.
Main Strategy of the Organization
With a history spanning more than 130 years, it has remained the top national university for science and technology of Japan. The organization wants to contribute to civilization, peace, prosperity in the world with an aim to develop human capabilities at a higher level through pioneering research and education facilities. For achieving this mission, they aim towards inspiring students to acquire not only scientific expertise but also expertise in the human ethics and liberal arts, along with a balanced knowledge of social sciences and business intelligence. They want their students to research deeply from basics to practice along with academic mastery to achieve overall excellence in the field. The mission of the organization is to contribute to global sustainability of the natural world and the support of human life by achieving their long-term goal of becoming the world’s leading science and technology university. They have around 1200 faculty and 600 staff members, with an overall span of around 10000 students.
Their main strategic objective has always been based upon the increasing importance of the role of science and technology. The corporation wants the betterment of society and solutions to global issues by cultivating global leaders in the field of research, science and technology. According to a report by Weekly Diamond in ,Tokyo Tech has proved to have the highest research standard in Japan in COE program. It also provides international programs for non-Japanese students, which is called Tokyo Tech’s International Graduate Program. They follow a five-feature strategy for improving their curriculum, which covers the aspects of systematic literacy and skills backed with strongly designed curriculum and research seminars focused on practical training through project reports.
They follow a wedge shaped style education, which allows students to understand the depth of science and technology and its impact on society, along with providing the ability to hone skills while learning independently and creatively. The organization wants their post-graduate and doctoral participants to learn fields related to their specialization along with their social background and relevance. Wedge-shaped education helps students inculcate deep insights, an ethical sense, and the practical ability to integrate creativity and academic ability, which would further build their character with inclusive values.
Analysis of Parent-Subsidiary network using NetDraw
Tokyo Institute of Technology has several branches in Japan, with numerous graduate and undergraduate schools, research laboratories, health services, student center, and tech front. These subsidiaries also include Inter-departmental organization for energy and environment, earth database center, and Tech Archive. In some of these subsidiaries and institutions, Tokyo Institute of Technology has a share of 100%. There are also some in which it is around 50% with the responsibility of handling various roles, management, and operations of the subsidiary. These are an integrated business part of the organization, and they play a crucial role in handling the operational execution and control, affecting the whole decision making process. NetDraw software has been used for performing centrality sensitivity analysis, which gives various important network visualizations for the measurement of significance of different nodes. It also produces exclusive node-attached diagrams along with customized layouts in a graphical mode. A clustering based method backs this analysis properly, as it segments several nodes into clusters on the basis of their group connections. A proper combination of the above described visualization techniques can be helpful in obtaining a step-wise formation of an upgraded level network, along with proper representations.
The objective of this project is to understand and study the operational working of Tokyo Institute of Technology as the main entity and related corporations as its division of working. The models discussed will give an idea about the involved centers of the network channels of Tokyo Institute of Technology and the operational details of the organization.
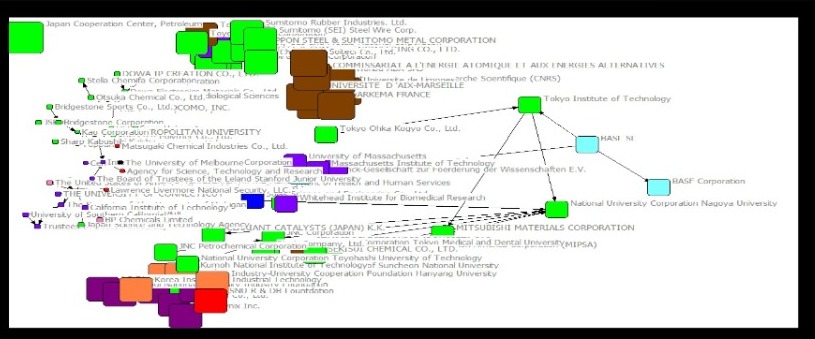
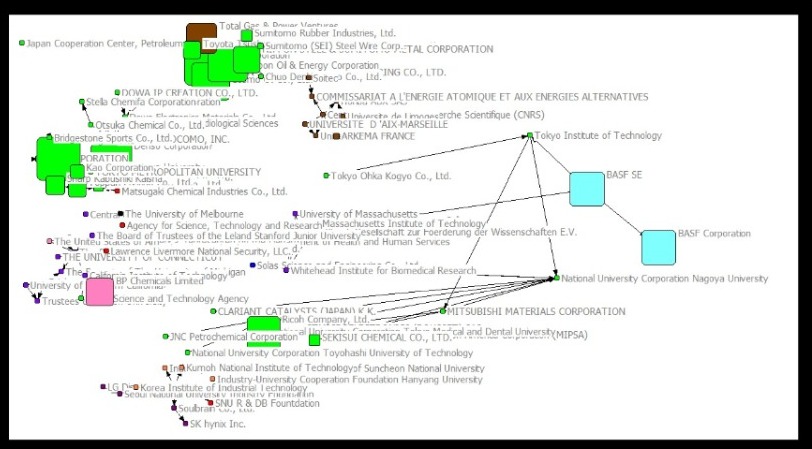
Figure 1: Country Code

From the above figure, it can be observed that Tokyo Institute of Technology has a total of 4 direct links, out of which three are from the same country (Japan), while one is from different country. The square shapes of the node vary with the country code. All of the relationships indicated in the above social network diagram are unidirectional in nature, with a single reporting system. Tokyo Institute of Technology is reporting relationship to Mitsubishi Materials Corporation and National University Corporation Nagoya University, while BASF SE and Tokyo Ohka Kogyo Co Ltd are reporting relationship to it.
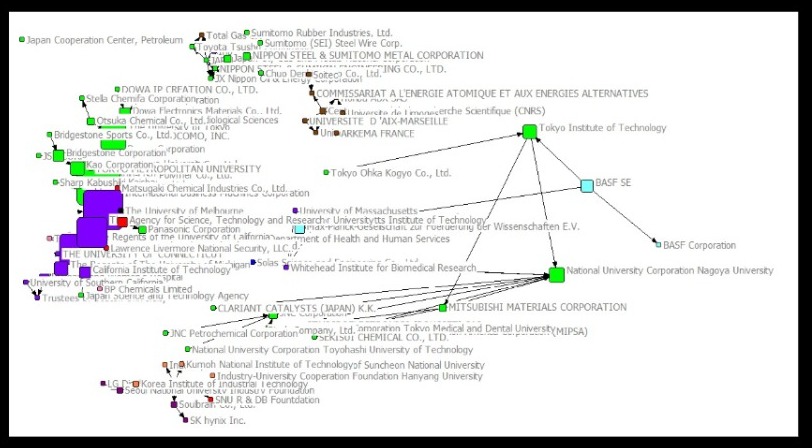
Figure 2: Closeness
The above figure gives an idea about the centrality closeness of the nodal network. It calculates the average distance from one node to another node in the network, based on which further calculations are done. Once the average distance calculation is done, each node is given score based on their closeness to all other nodes within the specified network. The shortest path distance between all nodes is calculated, after which a score is assigned to each node on the basis of its sum of shortest paths. One of the main advantages of the centrality closeness is that it segregates the individual nodes on the basis of their effectiveness in influencing the entire network in the minimum time. The clusters in the above figure have high closeness within their members, along with a high closeness centrality for the network. The difference in size of the squares of direct links of Tokyo Institute of Technology is bare minimum, which depicts the high closeness within the cluster.
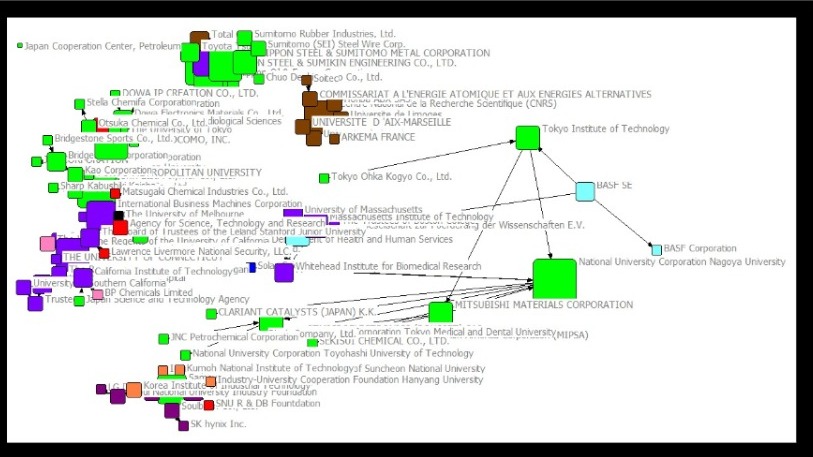
The betweenness is the shortest path between any two individual pair of the network. In the above figure, we can see that the smallest path has been drawn for further analysis. The quality of the path is also determined in this method, after which the centrality measure will be calculated. The underlying assumption of this method is that information flows primarily over the shortest paths between any two nodes. If we look at the above picture, we can see that BASF SE, National University Corporation Nagoya University, and Mitsubishi Materials Corporation are acting as bridges between nodes for the Tokyo Institute of Technology. The clusters formed between some of the channels have minimum intra-cluster distance and maximum inter-cluster distance, in such a manner that the whole system is optimized. The mapping of each navigation channel is done for all parts of the network. The formula used for calculating between distance of the nodes is [(n-1)*(n-2)/2]. The betweenness distance for the Tokyo Institute of Technology is found out to be 111 units, whereas it is 138 units for National University Corporation Nagoya University, 39 units for Mitsubishi Materials Corporation, and 95 units for BASF SE, and zero unit for Tokyo Ohka Kogyo Co Ltd.
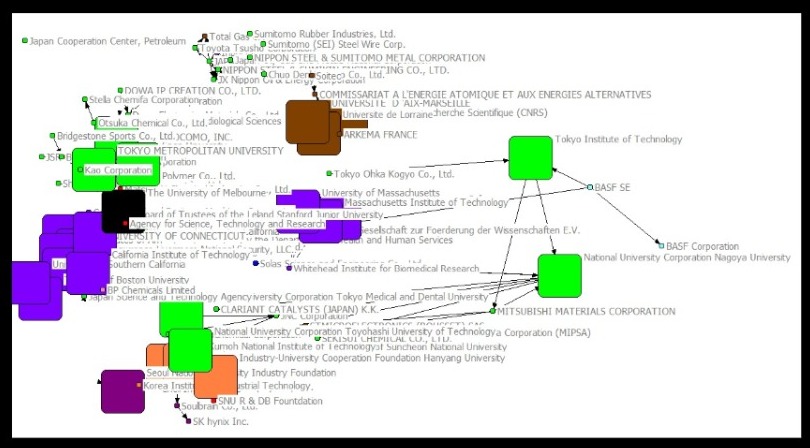
Figure 4: Country Code with Degree
The above figure depicts the degree centrality for the nodal network. Degree is used to represent the no of connections one node has with other nodes, and that is why, it has always been perceived as highly effective and efficient way of measuring influence power of a node. It is calculated by assigning a score based on the number of links held by that node. Degree gives us the no of direct connections that a particular node has with other nodes in the network. Wider base connections tend to have a higher degree, due to which they are effective for connection. In the above given figure, it can be seen that the National University Corporation, Nagoya University has the highest degree among the direct links of Tokyo Institute of Technology (represented by its bigger size). The parent organization is connected to 4 direct links and hence, its degree is 4. This figure allows us to observe the direct links between all nodes of the network.
Figure 5: Country Code with Eigen Vector

In the last section, we observed how the degree centrality is used to check the effectiveness of the node. This section deals about the Eigen centrality, which can be seen as an extension to the degree centrality. It also measures a node’s influence on the basis of no of direct links it has to other nodes within the given network. But, the special factor which differentiates it from degree centrality is that it also measures the strength of the connection and the no of links connected to the directly connected link. This measurement is continued for the whole network in the form of a chain analysis. It allows us to measure the influence of the nodes on the entire social network. Often considered as an old school method, it has given very good results over the past and it continues to be a ranking measurement method. Tokyo Institute of Technology has a very low Eigen vector, as it can be seen from the above figure, and subsequently, all of its direct links have negligible Eigen vectors.
Figure 6: Country Code with Patent Counts

Figure 7: Country Code with University
Tokyo Institute of Technology has been a research-focused institution, especially in the field of science and technology. However, the pictorial representation of no of patent counts in the corporation’s name is not an impressive one (exact value equal to 63). From the above figure, we can see that only Tokyo Institute of Technology and Nagoya University National Corporation have a university under them, which can be expected to impact the number of researches undergoing in the organization. But, in figure, it can be seen that National University Corporation Nagoya University has the maximum no of patents (1908), followed by BASF SE (1260), Mitsubishi Materials Corporation (448), and then, Tokyo Ohka Kogyo (252). From this case, we can say that the inclusion of a university in a corporation doesn’t certainly guarantee a high number of patent counts.
Figure 8: Country Code with Employees
The information about the no of employees in the parent corporation and some of the connected networks has not been provided in the dataset. Out of the directly associated networks, BASF SE has the highest no of employees, followed by Tokyo Ohka Kogyo Co Ltd. The number of employees associated with an organization can be directly associated with the social impact of the business, but since the data is not given here, we would not be able to comment anything upon that.
Figure 9: Country Code with Turnover Lay

BASF SE and Mitsubishi Materials Corporation are the top two highest turnover generating direct-linked corporations for Tokyo Institute of Technology, followed by National University Corporation Nagoya University and Tokyo Ohka Kogyo Co. Ltd. As we can see that the turnover for direct linked nodes have been more than the parent corporation, we can say that the networks have provided a strong foundation for the future step ahead, and Tokyo Tech is likely to benefit from these associations in a longer term, if they would be able to leverage this advantage.
Suggestions for Improvement and Performance Implications
Tokyo Institute of Technology encompasses both undergraduate and graduate education. It envisions students for possible academic paths with diverse choices based on the interests and pursuits. However, there can be some language barriers for international students in the organization for post graduate and doctoral programs, because even though the whole course would be taught in English, yet there is a minimal requirement of competence in Japanese. The situation is even worse for the Bachelor programs where all the lectures other than GSEP are taught in Japanese. This constrains the participation of non-Japanese students, who could have performed better in the academic research purpose, maybe increasing the no of patent counts.
Conclusion
Tokyo Institute of Technology offers a wide range of programs in science, architecture, engineering, computer science, biotechnology, and information science. They have produced some notable personalities and have performed pretty well in the field of science and technology. It has been gifted with talented faculty members and intelligent students, who have achieved some wonderful achievements over the years. However, the international participation in the organization can be improved by providing optional language system for lectures, other than Japanese. This could increase the diversity of the students, meanwhile improving the mutual learning atmosphere making it conducive for everyone. The dataset given has shown lesser no of patent counts than expected, which is needed to be improved by the corporation.
References
1. Katarzyna Growiec, 2018 May 02, Social network structure and the trade-off between social utility and economic performance, Science Direct
2. Atul Srivastava, 2014 Feb 08, Social Network Analysis: Hardly Easy, IEEE Journal
3. Emiko Kawaguchi, 2018 Mar 09, Tokyo Tech’s six-legged robots get closer to nature, Eureka Alert
4. Yuya Kajikawa, 2018 Dec, How do we innovate? – Finding a way using data analysis and knowledge engineering, Tokyo Tech Website
5. Andrew Disney, 2014 Dec 03, KeyLines FAQs: Social Network Analysis, Cambridge Intelligence
6. Yoga Yustiawan, 2015 Jan,Degree Centrality for Social Network with Opsahl Method, Science Direct
7. Neveen Ghali ,2012 Oct 13,Social Networks Analysis: Tools, Measures and Visualization, Springer
8. Anuya A. Ghanekar, 2015 Mar, Betweenness measure for social network analysis and image retrieval, Purdue University
Looking for best Statistics Assignment Help. Whatsapp us at +16469488918 or chat with our chat representative showing on lower right corner or order from here. You can also take help from our Live Assignment helper for any exam or live assignment related assistance.