QUESTION
1. Canada’s Tax and Transfer System: Access Table 202-0706 from the CANSIM database and download (or view) market, after-tax and total income information. Do this for 2001 and 2011, for the bottom and top income quintiles (use adjusted income to account for economies of scale).
(a) Explain why we might be interested in adjusted versus unadjusted income?
(b) What is the difference between market income, total income, and after-tax income?
(c) Compute the 80/20 ratio of each income type for 2001 and 2011 (like the 90/10 ratio from class, but with quintiles, since we do not have data on deciles).
(d) Based on your answer to part (b), comment on the redistributive properties of Canada’s tax and transfer system.
(e) How would your above discussion change if Canadian incomes were taxed proportionally for each income quintile?
2. Problem #1 in Chapter 2: Consider an individual with $5000 of annual nonlabour income. She has total available time of 80 hours oer week, for 52×80=4160 hours per year. Her current wage rate is $15.00 per hour, and she currently chooses to work 2000 hours in a year.
(a) Draw a labour-leisure diagram, carefully illustrating her current labour supply decision.
(b) The wage rate rises to $18.00 per hour, and she decides to work 2040 hours. At $18.00 per hour, if she worked 2200 hours per year, she would have been indifferent to her original work decision (in (a)). Show her new choice on a diagram, and calculate the income and substitution effects associated with the wage change. Calculate the compensated and uncompensated elasticities of labour supply implied by her response to the wage increase.
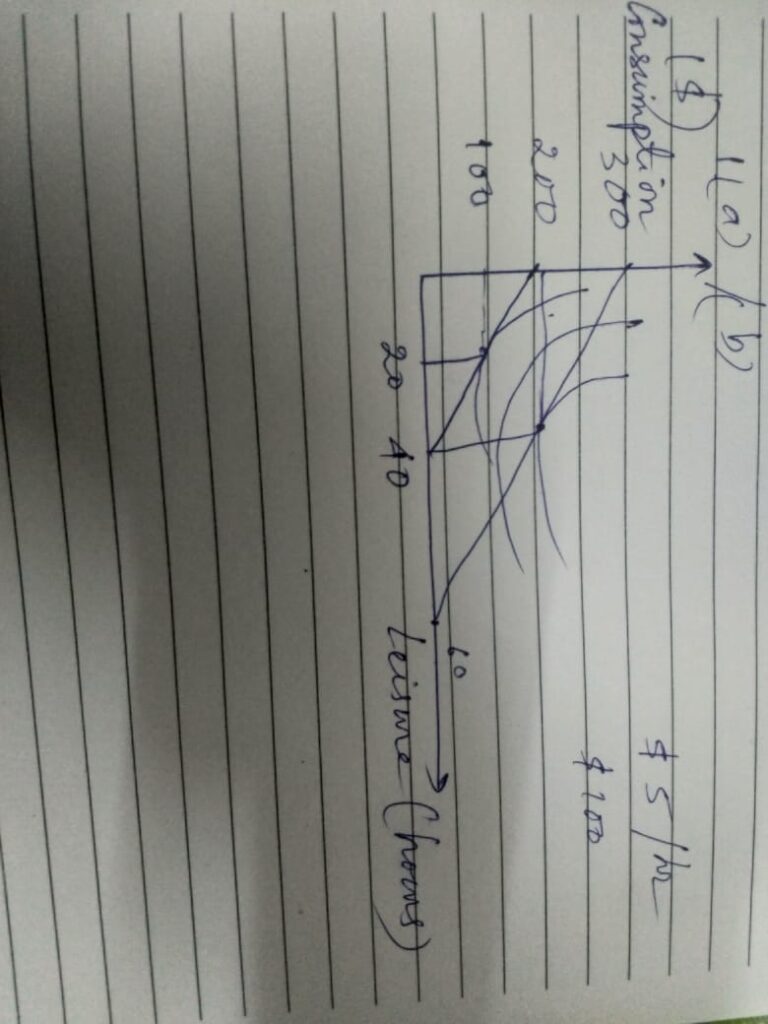
3. Problem #8 in Chapter 5: Curious George must decide how much to work. He has 60 hours per week available that he can spend either working or engaging in leisure (which for him is creating various kinds of mischief). He can work at a wage rate of $5 per hour. The Man with the Yellow Hat (who looks after George) also gives him an allowance of $100 per week, no matter how much George works. George’s only source of income that he can use for consumption (mostly bananas) is this allowance plus his wage earnings.
(a) In a carefully labelled diagram, draw George’s consumption-leisure budget constraint. Show an equilibrium where George chooses to work 40 hours per week.
(b) In an effort to have George pay for other household expenses, the Man with the Yellow Hat decides to tax George 50 percent of his wage income. Using the same diagram that you drew in (a), where George works 40 hours, show what happens to his labour supply. To do this, show one possible outcome, and break the change down into income and substitution effects. Do you have to make any assumptions for your analysis? (c) Instead of the wage tax, the Man with the Yellow Hat could impose a “poll tax,” a lump-sum tax independent of George’s wage earnings. This tax must raise the same revenue as the wage tax in part (b), and could be accomplished by reducing George’s allowance. Draw the budget constraint with the new tax and the wage tax, and compare the work incentive effects of the poll tax to the wage tax in (b). As in (b), assume that George was working 40 hours before any taxes were imposed.
ANSWER
-
a) Adjusted income comes into account in order to describe that when the number of people in a household grows the amount or the spending that they do may not grow linearly. This is because there are many things that the household may use for example soap oil which is shared among the number of members and does not cost double just because the number of people has doubled. Unadjusted income, on the other hand, makes these calculations linearly without considering these factors. Thus we are more interested in the adjusted income as it is a truer picture.
-
b) Market income is the amount of income that a person makes due to his engagement in the labor market activities. On the other hand, total income includes the transfer income on this. The after-tax income is the income that is left at the end of the day after all revenue and costs along with the taxes, and the transfer incomes have been accounted for
-
c)
|
20th P-tile |
80th P-tile |
80/20 Ratio |
||
|
2001 |
Market |
7000 |
97600 |
13.94 |
|
Total |
14300 |
100600 |
7.03 |
|
|
After Tax |
13800 |
76900 |
5.57 |
|
|
2011 |
Market |
7700 |
108400 |
14.08 |
|
Total |
16400 |
111700 |
6.81 |
|
|
After Tax |
16000 |
87100 |
5.44 |
-
d) The tax system of Canada actually takes into the most account the means and methods of redistributing the incomes that the people get. If we look into the data of 2001, we can easily see that the individuals in the 80 percentiles had 14 times more income than the ones in the 20 percentiles. However, once the transfers and the taxes are taken into account, this ratio drops to 7.03 then to 5.57 showing that the government actually is collecting more from the rich and dividing into the poor thus keeping it equal. Even in 2011 through the market income has increased manifold, the inequality has declined further to a ratio of 5.44 showing a very good system of redistribution in Canada
-
e)This will make the after-tax inequality higher if implemented in comparison to the present system
-
a) Here the total available hours per week is 80 and the total in a year is 4160 hours. On the current wage rate of $15 per hour she has decided to work for 2000 hours a year. Depending on the current labour supply decision the labour-leisure diagram is drawn where the y-axis depicts the consumption i.e. the wage that can be earned and the x-axis depicts the leisure where out of the total available time she has decided to work for some time.
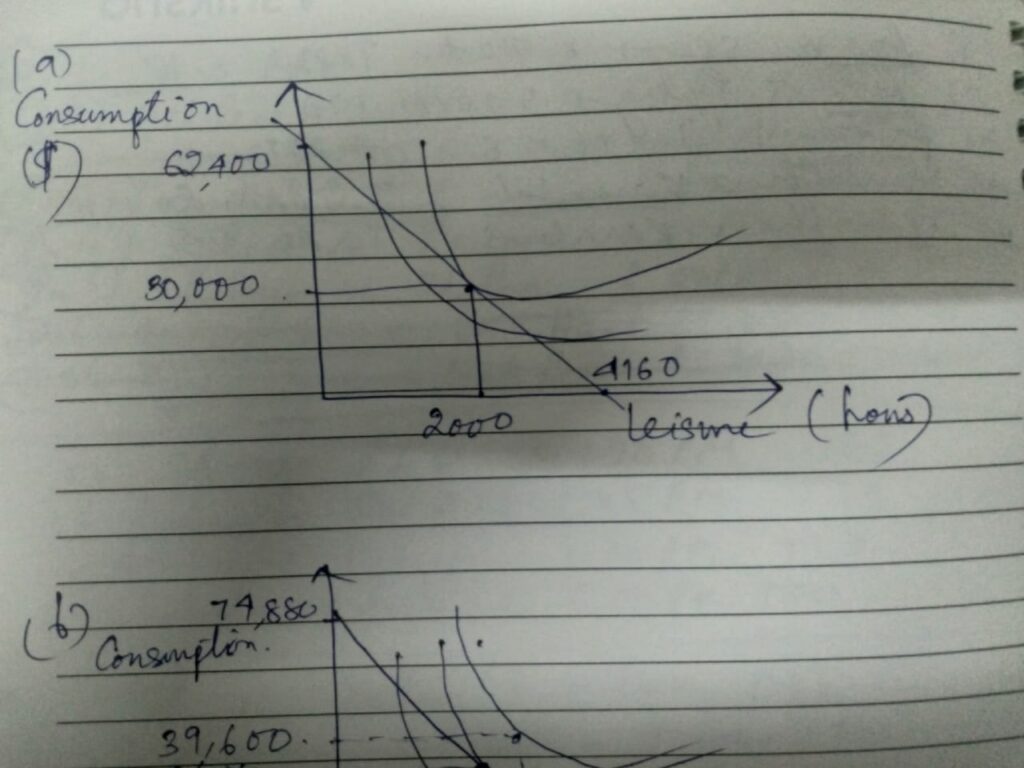
b) Similarly the diagram is drawn where the wage rate rises to $18 per hour and she has decide to work for 2040 hours and then again there is another condition given for 2200 hours. The corresponding variations are noted and the labour-leisure decision and changes is noted in the graph.

3. Inquisitive George must choose the amount to work. He has 60 hours out of every week accessible that he can spend either working or taking part in relaxation (which for him is making different sorts of fiendishness). He can work at a wage rate of $5 every hour. The Man with the Yellow Hat (who cares for George) additionally gives him a recompense of $100 every week, regardless of the amount George works. George’s solitary wellspring of salary that he can use for utilization (for the most part bananas) is this stipend in addition to his wage profit.
a) Here the consumption-leisure diagram is drawn with the budget constraint where the total available hours is 60 and the wage rate is $5 per hour. George has decided to work for 40 hours.
b) In this part George has been taxed 50 percent oh his wage income which has decreased his consumption and decreased the labour hours virtually because the working hours have been decreased to 20 and the leisure hours are virtually increased.
The following diagram depicts the corresponding consumption-leisure diagram of part a and b where th changes are shown for 60, 40 and 20 hours.
Looking for best Economics Assignment Help. Whatsapp us at +16469488918 or chat with our chat representative showing on lower right corner or order from here. You can also take help from our Live Assignment helper for any exam or live assignment related assistance.