QUESTION

ANSWER
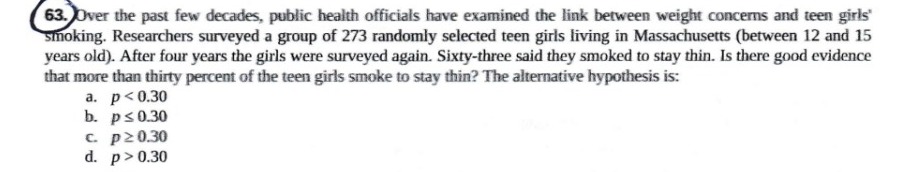
63. Ans. (d) p > 0.30
We will state null hypothesis as – The proportion of girls who smoked to stay thin is 0.30. Hence, the alternate hypothesis will be – The proportion of girls who smoked to stay thin is more than 0.30.
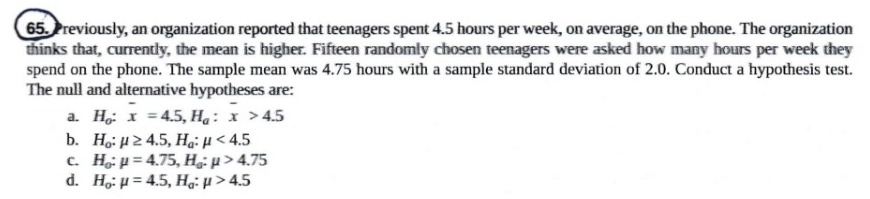
65. Ans. (d) H0: µ = 4.5, Ha: µ > 4.5
The organization wants to prove that the mean hours spent per week is greater than 4.5, and it was earlier 4.5 hours per week. Hence, the null hypothesis will be – The mean hours spent on phone per week by teenagers is 4.5; whereas the alternate hypothesis will be – The mean hours spent on phone per week by teenagers is more than 4.5.
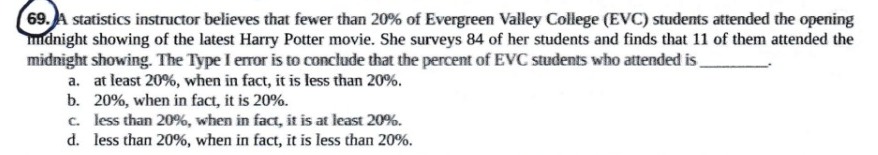
69. Ans. (c) less than 20%, when in fact, it is at least 20%
In this question, the hypotheses will be as –
H0: p > 0.20 (The proportion of EVC students who attended the midnight showing of Harry Potter is greater than or equal to 20%.)
Ha: p < 0.20 (The proportion of EVC students who attended the midnight showing of Harry Potter is less than 20%.)
Type I error is defined as rejecting the null hypothesis, even when it is in fact true.
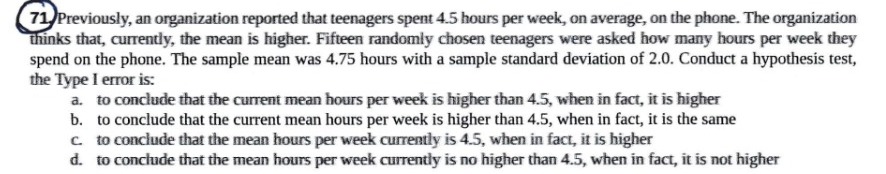
71. Ans. (b) to conclude that the current mean hours per week is higher than 4.5, when in fact, it is the same
For this experiment, we would take our hypotheses as –
H0: µ = 4.5, Ha: µ > 4.5
Type 1 error, i.e. Alpha, is defined as rejecting the null hypothesis (H0) when it is in fact true.
Putting all the values in our hypothesis, we would get the result.
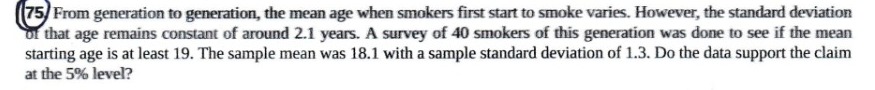
75. Ans. The data supports the claim at the 5% level.
The solution is as follows: –
- H0: The mean age when smokers first start smoking is at least 19 years. (µ > 19).
- Ha: The mean age when smokers first start smoking is less than 19 years. (µ < 19).
- Significance Level, α = 0.05.
- Let be the mean age at which a smoker starts to smoke for the first time.
- The distribution is a normal distribution.
- z = – 2.71
- p-value = 0.0034
- As p-value is less than the significance level, we reject the null hypothesis.
- Conclusion – The mean age when smokers first start smoking is less than 19 years. (µ < 19).
- Confidence Interval = [17.45,18.76]
77. Ans. The data supports the claim at the 1% level.
The solution is as follows: –
- H0: The mean time taken by California state university students to complete their undergraduate degree is less than or equal to 4.5. (µ < 4.5).
- Ha: The mean time taken by California state university students to complete their undergraduate degree is more than 4.5. (µ > 4.5).
- Significance Level, α = 0.01.
- Let be the average time to finish an undergraduate degree.
- The distribution is a student’s-t distribution.
- t = 3.5
- p-value = 0.0005
- As p-value is less than the significance level, we reject the null hypothesis.
- Conclusion – The mean time taken by California state university students to complete their undergraduate degree is more than 4.5. (µ > 4.5).
- Confidence Interval = [4.755,5.445]
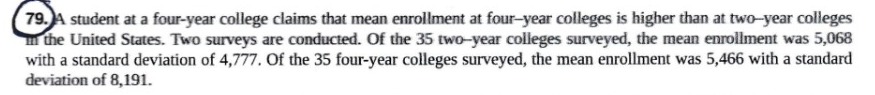
79. Ans. We have two subscripts here – 1. two-year colleges, 2. four-year colleges
The solution is as follows: –
- H0: The mean enrolment in four-year colleges is less than or equal to that in two-year colleges. (μ1 ≥ μ2).
- Ha: The mean enrolment in four-year colleges is greater than that in two-year colleges. (μ1 < μ2).
- Let be the difference between the mean enrolment of the two-year and four-year colleges.
- The distribution is a student’s-t distribution.
- Test statistic = – 0.2480
- p-value = 0.4019
- As p-value is greater than the significance level, we fail to reject the null hypothesis.
- Conclusion – There is not enough evidence to prove that the mean enrolment in four-year colleges is greater than that in two-year colleges.
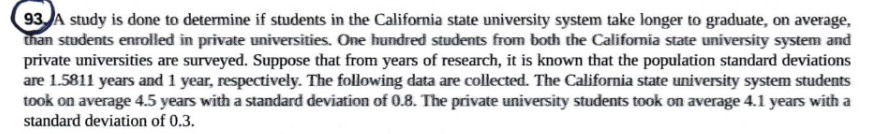
93. Ans. We have two subscripts here – 1. California State Universities, 2. Private Universities
The solution is as follows: –
- H0: The average time taken by California State Universities students to graduate is less than or equal to those by private universities students. (μ1 < μ2).
- Ha: The average time taken by California State Universities students to graduate is less than or equal to those by private universities students. (μ1 > μ2).
- Let be the difference between the mean time for graduation for California State Universities students and private universities students.
- The distribution is a normal distribution.
- Test statistic, z = 2.14
- p-value = 0.0163
- For significance level of 5%, p-value is less than the significance level, we will reject the null hypothesis.
- Conclusion – The average time taken by California State Universities students to graduate is less than or equal to those by private universities students.
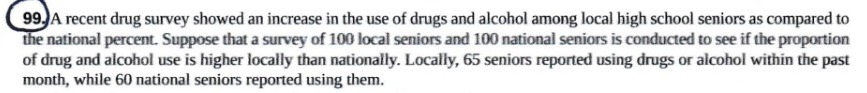
99. Ans. We have two subscripts here – 1. Local, 2. National
The solution is as follows: –
- H0: The proportion of drug use in local seniors is less than or equal to those for national seniors. (p1 < p2).
- Ha: The proportion of drug use in local seniors is greater than those for national seniors. (p1 > p2).
- Let p1 – p2 be the difference between the difference in the proportions of local seniors and national seniors.
- The distribution is a normal distribution for two proportions.
- Test statistic = 0.73
- p-value = 0.2326
- For significance level of 5%, p-value is greater than the significance level, we fail to reject the null hypothesis.
- Conclusion – The proportion of drug use in local seniors is less than or equal to those for national seniors
Looking for best Statistics Assignment Help. Whatsapp us at +16469488918 or chat with our chat representative showing on lower right corner or order from here. You can also take help from our Live Assignment helper for any exam or live assignment related assistance