QUESTION


Introduction:
This case analyzes the relationship between risk and return in capital markets. Using financial market data, we study the concepts of return, standard deviation, correlation, and risk, as well as the impact of forming portfolios of stocks on risk and return.
Tools
Use Excel’s statistical functions and graphics capabilities to study the data provided in the case’s Exhibits 1 and 2, which you can download from Canvas. We do not use the international data contained in Exhibit 3.
Questions:
Please address the following questions in your presentation.
1. [Executive Summary] Given your analysis below, provide Richard Eckstrom with some recommendations regarding the investment strategy that the State of South Carolina should adopt and how to defend it.
2. Exhibit 1 provides the annual returns for Treasury bills, Treasury bonds, corporate bonds, and common stocks over the 1926-1997 period in the United States.
(a) Using this sample, estimate the average annual return, minimum return, maximum return, and standard deviation for each asset class.
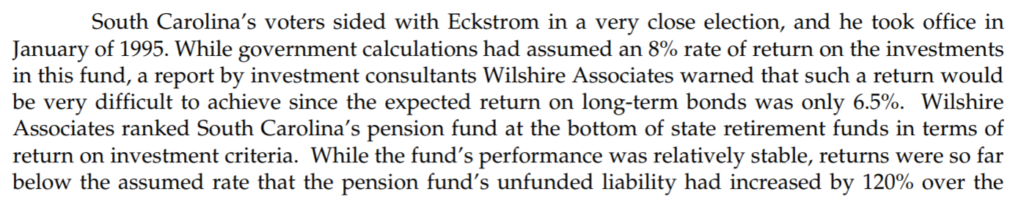
(b) Suppose that you invested one dollar in each asset class at the beginning of 1926. How much wealth would you have in each at the end of 1997?
(c) Plot the trajectories in (b) above. What does this tell you about the risk-return relationship for each asset class?
3. Exhibit 2 provides the monthly returns for 30 stocks.
(a) Estimate the average monthly return and standard deviation for each stock.
(b) Make a scatter plot for the thirty stocks with standard deviation on the x-axis and average monthly return on the y-axis. Is there an obvious relationship between these two statistics?
4. Consider equal-weighted1 and value-weighted2 portfolios (two assets each) of Exxon, General Motors, and General Electric (i.e., EX+GM, EX+GE, GE+GM), i.e., 6 portfolios in total (3 equal-weighted and 3 value-weighted).
(a) Calculate the realized returns for each of these portfolios for every month during the January 1990 to June 1998 period. Note that the weights of the value-weighted portfolios change each month.
(b) Using these realized portfolio returns, estimate the mean monthly return and standard deviation of each portfolio.
(c) Is there anything noteworthy about the standard deviation of some of these portfolios compared to those of the individual stocks? If so, why do you think this occurs?
5. Form value-weighted portfolios of one stock, five stocks, ten stocks, and thirty stocks. Start alphabetically in forming these portfolios. For example, the five-stock portfolio should contain Aluminum Company America, Allied Signal, AMEX, AT&T, and Bethlehem Steel.
(a) As before, start by calculating the realized returns for each of these portfolios for every month. Note again that the weights of the value-weighted portfolios change each month.
(b) Estimate the mean monthly return and standard deviation of each portfolio.
(c) Make a plot with standard deviation on the y-axis and number of assets of the x-axis. Describe what you see and why this should arise.
Exhibit 1
| Exhibit 1 Annual Total Returns 1926-1997 (in percent) | |||||
| Year | Inflation | Treasury Bills | Treasury Bonds | Corporate Bonds | Common Stocks |
| 1926 | -1.49 | 3.27 | 7.77 | 7.37 | 11.62 |
| 1927 | -2.08 | 3.12 | 8.93 | 7.44 | 37.49 |
| 1928 | -0.97 | 3.56 | 0.1 | 2.84 | 43.61 |
| 1929 | 0.2 | 4.75 | 3.42 | 3.27 | -8.42 |
| 1930 | -6.03 | 2.41 | 4.66 | 7.98 | -24.9 |
| 1931 | -9.52 | 1.07 | -5.31 | -18.5 | -43.34 |
| 1932 | -10.3 | 0.96 | 16.84 | 10.82 | -8.19 |
| 1933 | 0.51 | 0.3 | -0.07 | 10.38 | 53.99 |
| 1934 | 2.03 | 16 | 10.03 | 13.84 | -1.44 |
| 1935 | 2.99 | 0.17 | 4.98 | 9.16 | 47.67 |
| 1936 | 1.21 | 0.18 | 7.52 | 6.74 | 33.92 |
| 1937 | 3.1 | 0.31 | 0.23 | 2.75 | -35.03 |
| 1938 | -2.78 | -0.02 | 5.53 | 6.13 | 31.12 |
| 1939 | -0.48 | 0.02 | 4.52 | 3.97 | -0.41 |
| 1940 | 0.96 | 0 | 2.96 | 3.39 | -9.78 |
| 1941 | 9.72 | 0.06 | 0.93 | 2.73 | -11.59 |
| 1942 | 9.29 | 0.27 | 3.22 | 2.6 | 20.34 |
| 1943 | 3.16 | 0.35 | 2.08 | 2.83 | 25.9 |
| 1944 | 2.11 | 0.33 | 2.81 | 4.73 | 19.75 |
| 1945 | 2.25 | 0.33 | 10.73 | 4.08 | 36.44 |
| 1946 | 18.16 | 0.35 | -0.1 | 1.72 | -8.07 |
| 1947 | 9.01 | 0.5 | -2.62 | -2.34 | 5.71 |
| 1948 | 2.71 | 0.81 | 3.4 | 4.14 | 5.5 |
| 1949 | -1.8 | 1.1 | 6.45 | 3.31 | 18.79 |
| 1950 | 5.79 | 1.2 | 0.06 | 2.12 | 31.71 |
| 1951 | 5.87 | 1.49 | -3.93 | -2.69 | 24.02 |
| 1952 | 0.88 | 1.66 | 1.16 | 3.52 | 18.37 |
| 1953 | 0.62 | 1.82 | 3.64 | 3.41 | -0.99 |
| 1954 | -0.5 | 0.86 | 7.19 | 5.39 | 52.62 |
| 1955 | 0.37 | 1.57 | -1.29 | 0.48 | 31.56 |
| 1956 | 2.86 | 2.46 | -5.59 | -6.81 | 6.56 |
| 1957 | 3.02 | 3.14 | 7.46 | 8.71 | -10.78 |
| 1958 | 1.76 | 1.54 | -6.09 | -2.22 | 43.36 |
| 1959 | 1.5 | 2.95 | -0.39 | -0.97 | 11.96 |
| 1960 | 1.48 | 2.66 | 13.78 | 9.07 | 0.47 |
| 1961 | 0.67 | 2.13 | 0.97 | 4.82 | 26.89 |
| 1962 | 1.22 | 2.73 | 6.89 | 7.95 | -8.73 |
| 1963 | 1.65 | 3.12 | 1.21 | 2.19 | 22.8 |
| 1964 | 1.19 | 3.54 | 3.51 | 4.77 | 16.48 |
| 1965 | 1.92 | 3.93 | 0.71 | -0.46 | 12.45 |
| 1966 | 3.35 | 4.76 | 4.69 | 0.2 | -10.06 |
| 1967 | 3.04 | 4.21 | -9.18 | -4.95 | 23.98 |
| 1968 | 4.72 | 5.21 | -0.26 | 2.57 | 11.06 |
| 1969 | 6.11 | 6.58 | -5.07 | -8.09 | -8.5 |
| 1970 | 5.49 | 6.52 | 12.11 | 18.37 | 4.01 |
| 1971 | 3.36 | 4.39 | 13.23 | 11.01 | 14.31 |
| 1972 | 3.41 | 3.84 | 5.69 | 7.26 | 18.98 |
| 1973 | 8.8 | 6.93 | -1.11 | 1.14 | -14.66 |
| 1974 | 12.2 | 8 | 4.35 | -3.06 | -26.47 |
| 1975 | 7.01 | 5.8 | 9.2 | 14.64 | 37.2 |
| 1976 | 4.81 | 5.08 | 16.75 | 18.65 | 23.84 |
| 1977 | 6.77 | 5.12 | -0.69 | 1.71 | -7.18 |
| 1978 | 9.03 | 7.18 | -1.18 | -0.07 | 6.56 |
| 1979 | 13.31 | 10.38 | -1.23 | -4.18 | 18.44 |
| 1980 | 12.4 | 11.24 | -3.95 | -2.76 | 32.42 |
| 1981 | 8.94 | 14.71 | 1.86 | -1.24 | -4.91 |
| 1982 | 3.87 | 10.54 | 40.36 | 42.56 | 21.41 |
| 1983 | 3.8 | 8.8 | 0.65 | 6.26 | 22.51 |
| 1984 | 3.95 | 9.85 | 15.48 | 16.86 | 6.27 |
| 1985 | 3.77 | 7.72 | 30.97 | 30.09 | 32.16 |
| 1986 | 1.13 | 6.16 | 24.53 | 19.85 | 18.47 |
| 1987 | 4.41 | 5.47 | -2.71 | -0.27 | 5.23 |
| 1988 | 4.42 | 6.35 | 9.67 | 10.7 | 16.81 |
| 1989 | 4.65 | 8.37 | 18.11 | 16.23 | 31.49 |
| 1990 | 6.11 | 7.81 | 6.18 | 6.78 | -3.17 |
| 1991 | 3.06 | 5.6 | 19.3 | 19.89 | 30.55 |
| 1992 | 2.9 | 3.51 | 8.05 | 9.39 | 7.67 |
| 1993 | 2.75 | 2.9 | 18.24 | 13.19 | 9.99 |
| 1994 | 2.67 | 3.9 | -7.77 | -5.76 | 1.31 |
| 1995 | 2.74 | 5.6 | 31.67 | 27.2 | 37.43 |
| 1996 | 3.32 | 5.21 | -0.93 | 1.4 | 23.07 |
| 1997 | 1.7 | 5.26 | 15.88 | 12.95 | 33.36 |
Exhibit 2a
| Exhibit 2 Monthly Returns for Dow 30 Stocks | |||||||||||
| ALUMINUM COMPANY AMER | ALLIED SIGNAL INC | AMERICAN EXPRESS CO | AT&T | ||||||||
| Return (%) | Market Cap ($ bil) | Return (%) | Market Cap ($ bil) | Return (%) | Market Cap ($ bil) | Return (%) | Market Cap ($ bil) | ||||
| 31-Jan-90 | -15.8 | 6.59 | -2.5 | 5.23 | -14.7 | 14.55 | -14.3 | 48.94 | |||
| 28-Feb-90 | 4.7 | 5.39 | 4.6 | 5.1 | -2.1 | 12.41 | 1.9 | 41.95 | |||
| 30-Mar-90 | 0.8 | 5.64 | 5.3 | 5.27 | -11.6 | 12.15 | 6.5 | 42.75 | |||
| 30-Apr-90 | -3.6 | 5.69 | -5.1 | 5.33 | 6.2 | 10.74 | -4.5 | 45.18 | |||
| 31-May-90 | 6.5 | 5.44 | 5.2 | 5.06 | 7.8 | 11.31 | 7.5 | 43.17 | |||
| 29-Jun-90 | -3.4 | 5.8 | 0.7 | 5.26 | 5.9 | 12.2 | -10 | 46.39 | |||
| 31-Jul-90 | 9.7 | 5.54 | -8.2 | 5.29 | -5.3 | 12.82 | -3.9 | 41.93 | |||
| 31-Aug-90 | -7.4 | 6.04 | -6.8 | 4.86 | -17.2 | 12.14 | -12.5 | 40.29 | |||
| 28-Sep-90 | -2.7 | 5.6 | -10.1 | 4.46 | -12.4 | 10.06 | -3.6 | 35.26 | |||
| 31-Oct-90 | -14.5 | 5.4 | -9.9 | 3.86 | -9.6 | 9.77 | 10.1 | 33.62 | |||
| 30-Nov-90 | 3.3 | 4.58 | 12.2 | 3.48 | 8.6 | 8.73 | -5.5 | 37.03 | |||
| 31-Dec-90 | 5 | 4.73 | -2.7 | 3.84 | 1.7 | 9.48 | -5.2 | 34.99 | |||
| 31-Jan-91 | 12.7 | 4.89 | 7.4 | 3.64 | 10.3 | 9.57 | 8.3 | 32.81 | |||
| 28-Feb-91 | -0.4 | 5.46 | 4.1 | 3.91 | 5.5 | 10.55 | 2.3 | 35.53 | |||
| 28-Mar-91 | 2.1 | 5.44 | -2.5 | 4.01 | 20.3 | 11.13 | 3.6 | 36.35 | |||
| 30-Apr-91 | 3.7 | 5.56 | 2.2 | 3.91 | -12.6 | 13.41 | 9.1 | 37.41 | |||
| 31-May-91 | 5.4 | 5.73 | 2.4 | 3.99 | 2.5 | 11.61 | -0.7 | 40.82 | |||
| 28-Jun-91 | -5.1 | 6.03 | 10.5 | 4.02 | -11.3 | 11.9 | 3.9 | 40.55 | |||
| 31-Jul-91 | 5.2 | 5.73 | 17.8 | 4.48 | 12.8 | 10.56 | 4.2 | 41.97 | |||
| 30-Aug-91 | -1.9 | 5.99 | -0.1 | 5.28 | 4.4 | 11.91 | -2.2 | 43.75 | |||
| 30-Sep-91 | -7.8 | 5.88 | -5.5 | 5.21 | -2.4 | 12.43 | -3 | 42.79 | |||
| 31-Oct-91 | -0.2 | 5.43 | 14.5 | 4.95 | -25.9 | 12.04 | 3.7 | 48.97 | |||
| 29-Nov-91 | -7.7 | 5.39 | -5.7 | 5.67 | 0 | 8.93 | -6.4 | 50.76 | |||
| 31-Dec-91 | 10 | 4.98 | 12.9 | 5.31 | 9.2 | 8.93 | 8.5 | 47.5 | |||
| 31-Jan-92 | 0.2 | 5.48 | 12.8 | 6.03 | 0.6 | 9.64 | -4.8 | 51.1 | |||
| 28-Feb-92 | 8.2 | 5.49 | 0.8 | 6.8 | 1.8 | 9.7 | -0.3 | 48.66 | |||
| 31-Mar-92 | 1.6 | 5.9 | 1.8 | 6.82 | 10.1 | 9.88 | 10.7 | 48.49 | |||
| 30-Apr-92 | 10.3 | 6 | 15.3 | 6.98 | -1.6 | 10.8 | 6.1 | 53.86 | |||
| 29-May-92 | 0.3 | 6.58 | 0 | 8.05 | 1.1 | 10.62 | -1.7 | 57.16 | |||
| 30-Jun-92 | -2.3 | 6.6 | -7.3 | 8.01 | 3.3 | 10.74 | 2 | 56.17 | |||
| 31-Jul-92 | -2.8 | 6.49 | 3.3 | 7.54 | -1.1 | 11.04 | 2 | 57.03 | |||
| 31-Aug-92 | -11.8 | 6.31 | -5.2 | 7.78 | -9.2 | 10.92 | -3.7 | 58.19 | |||
| 30-Sep-92 | 2.5 | 5.53 | -0.7 | 7.34 | 6 | 9.91 | 4 | 56.04 | |||
| 30-Oct-92 | 5.3 | 5.67 | 6.7 | 7.34 | -2.3 | 10.43 | 0 | 58.02 | |||
| 30-Nov-92 | 1.1 | 5.97 | 3.4 | 7.83 | 7 | 10.19 | 8 | 58.02 | |||
| 31-Dec-92 | 2.1 | 6.01 | 5.9 | 8.06 | 8.7 | 10.91 | 8.9 | 62.67 | |||
| 29-Jan-93 | 3.8 | 6.14 | -4.8 | 8.57 | -5.5 | 11.89 | 3.7 | 68.12 | |||
| 26-Feb-93 | -5.2 | 6.37 | 14.8 | 8.16 | 5.4 | 11.11 | 5.7 | 70.62 | |||
| 31-Mar-93 | -8 | 6.01 | 1.1 | 9.33 | 11.7 | 11.71 | 2.2 | 74.63 | |||
| 30-Apr-93 | 2.5 | 5.53 | -2.1 | 9.45 | 3.2 | 12.97 | -1.5 | 75.8 | |||
| 28-May-93 | 2.7 | 5.67 | 2.7 | 9.26 | 2.7 | 13.38 | 10.1 | 74.63 | |||
| 30-Jun-93 | 3.7 | 5.78 | 0 | 9.47 | 12.2 | 13.74 | 3 | 82.14 | |||
| 30-Jul-93 | 1.8 | 6.17 | 5.1 | 9.47 | 1.9 | 15.52 | 0.6 | 84.68 | |||
| 31-Aug-93 | 6 | 6.28 | 7 | 9.95 | -0.4 | 15.7 | -0.8 | 85.19 | |||
| 30-Sep-93 | -10.6 | 6.62 | -2.5 | 10.61 | 10.4 | 15.64 | -5.8 | 84.51 | |||
| 29-Oct-93 | 1.3 | 5.92 | -1.7 | 10.28 | -9.4 | 17.42 | -2.3 | 79.34 | |||
| 30-Nov-93 | 2.4 | 6 | -0.3 | 10.1 | -2.7 | 15.66 | -5 | 77.49 | |||
| 31-Dec-93 | 0.2 | 6.11 | 11.1 | 10.08 | -1.6 | 15.23 | -3.3 | 73.76 | |||
| 31-Jan-94 | 14.6 | 6.13 | -0.5 | 11.19 | 6.5 | 15.08 | 8.1 | 70.89 | |||
| 28-Feb-94 | -4.9 | 6.99 | -2.5 | 11.14 | -10.3 | 15.94 | -7.5 | 76.63 | |||
| 31-Mar-94 | -4.8 | 6.65 | -4.4 | 10.34 | -5.1 | 14.29 | -1.8 | 70.89 | |||
| 29-Apr-94 | -5.1 | 6.33 | -5.5 | 10.36 | 7.7 | 13.56 | 0 | 69.31 | |||
| 31-May-94 | 4.4 | 6.01 | 2.3 | 9.79 | 5.4 | 14.51 | 6.6 | 69.31 | |||
| 30-Jun-94 | 3.5 | 6.24 | -1.4 | 9.97 | -6.8 | 13.53 | 0.1 | 73.87 | |||
| 29-Jul-94 | 7 | 6.5 | 10.5 | 9.85 | 3.8 | 12.74 | 0.5 | 73.82 | |||
| 31-Aug-94 | 7.9 | 6.95 | -1.9 | 10.88 | 6.1 | 13.11 | 0 | 74.16 | |||
| 30-Sep-94 | 0.9 | 7.46 | -8.7 | 10.63 | 8 | 13.91 | -0.5 | 74.16 | |||
| 31-Oct-94 | 1.1 | 7.54 | 1.5 | 9.65 | 2.4 | 15.03 | 1.9 | 84.75 | |||
| 30-Nov-94 | -4.3 | 7.58 | -5.3 | 9.79 | -4 | 15.28 | -10.7 | 86.29 | |||
| 30-Dec-94 | 6.1 | 7.29 | 4.2 | 9.23 | 0.3 | 15.02 | 3 | 76.78 | |||
| 31-Jan-95 | -9 | 7.74 | 5.1 | 9.62 | 6.8 | 14.95 | -0.7 | 78.54 | |||
| 28-Feb-95 | -0.8 | 7.02 | 6.5 | 10.12 | 6.7 | 15.97 | 3.5 | 77.96 | |||
| 31-Mar-95 | 6.4 | 6.97 | 3.6 | 10.72 | 3.7 | 17.04 | 0.9 | 80.69 | |||
| 28-Apr-95 | 8.1 | 7.42 | 1 | 11.11 | 0.3 | 17.29 | -1.9 | 81.2 | |||
| 31-May-95 | 4.1 | 8.03 | 2.4 | 11.22 | 2.2 | 17.23 | 0 | 79.63 | |||
| 30-Jun-95 | 7.8 | 8.28 | 10.2 | 11.48 | -0.7 | 17.6 | 5.1 | 80.3 | |||
| 31-Jul-95 | 13.7 | 8.93 | 5.1 | 12.65 | 9.9 | 17.48 | -0.5 | 83.86 | |||
| 31-Aug-95 | 0.6 | 10.15 | -4.7 | 13.29 | 4.9 | 19.09 | 7.3 | 83.46 | |||
| 29-Sep-95 | -7.4 | 10.2 | -0.6 | 12.57 | 9.9 | 19.69 | 16.7 | 89.83 | |||
| 31-Oct-95 | -3.5 | 9.44 | -3.7 | 12.49 | -7.9 | 21.64 | -2.7 | 104.3 | |||
| 30-Nov-95 | 15.1 | 9.1 | 11.9 | 12.03 | 4.6 | 19.81 | 2.9 | 101.53 | |||
| 29-Dec-95 | -9.6 | 10.37 | 0.3 | 13.4 | -2.6 | 20.59 | -1.2 | 104.86 | |||
| 31-Jan-96 | 5.6 | 9.37 | 5 | 13.44 | 11.7 | 20.04 | 3.3 | 103.07 | |||
| 29-Feb-96 | 2.5 | 9.84 | 12 | 14.11 | -0.3 | 22.28 | -4.9 | 106.46 | |||
| 29-Mar-96 | 10.1 | 10.08 | 6.3 | 15.73 | 7.6 | 22.22 | -3.4 | 101.28 | |||
| 30-Apr-96 | -0.4 | 10.96 | -1.9 | 16.72 | -1.3 | 23.85 | 0.2 | 97.72 | |||
| 31-May-96 | -0.7 | 10.92 | -5.2 | 16.4 | -5.7 | 23.43 | 1.8 | 97.92 | |||
| 28-Jun-96 | -6.9 | 10.83 | 4.3 | 15.48 | -2.5 | 22.1 | -0.1 | 99.72 | |||
| 31-Jul-96 | 1.7 | 10.08 | 2.8 | 16.15 | -1.5 | 21.56 | -15.7 | 99.63 | |||
| 30-Aug-96 | 7.1 | 10.19 | 5.5 | 16.61 | 0 | 20.93 | 0.5 | 83.96 | |||
| 30-Sep-96 | -5 | 10.82 | 6.7 | 17.46 | 5.7 | 20.93 | 0.2 | 84.36 | |||
| 31-Oct-96 | -0.1 | 10.27 | -0.6 | 18.63 | 2.1 | 21.94 | -8.5 | 84.25 | |||
| 29-Nov-96 | 8.5 | 10.21 | 12.2 | 18.52 | 11.2 | 22.29 | 12.1 | 56.66 | |||
| 31-Dec-96 | 0.2 | 11.03 | -8.5 | 20.71 | 8.6 | 24.78 | 11.4 | 63.54 | |||
| 31-Jan-97 | 8.2 | 11.05 | 5 | 18.95 | 10 | 26.77 | -4.7 | 70.28 | |||
| 28-Feb-97 | 3.6 | 11.96 | 3 | 19.9 | 5.6 | 29.44 | 1.3 | 63.8 | |||
| 31-Mar-97 | -4.6 | 12.35 | -1.4 | 20.43 | -8.8 | 31.1 | -11.7 | 64.61 | |||
| 30-Apr-97 | 3.1 | 11.75 | 1.4 | 20.15 | 10.2 | 28.37 | -3.9 | 56.51 | |||
| 30-May-97 | 5.4 | 12.07 | 6.6 | 20.43 | 5.7 | 31.16 | 9.7 | 54.43 | |||
| 30-Jun-97 | 2.4 | 12.78 | 9.4 | 21.72 | 7.2 | 32.86 | -3.7 | 59.71 | |||
| 31-Jul-97 | 17.4 | 13.09 | 9.8 | 23.77 | 12.7 | 35.09 | 5 | 56.97 | |||
| 29-Aug-97 | -6.8 | 15.37 | -10.2 | 26.11 | -7.2 | 39.45 | 5.9 | 59.81 | |||
| 30-Sep-97 | -0.3 | 14.31 | 3 | 23.37 | 5.3 | 36.45 | 14.3 | 63.35 | |||
| 31-Oct-97 | -11 | 14.26 | -15.3 | 24.05 | -4.5 | 38.38 | 10.5 | 71.88 | |||
| 28-Nov-97 | -7.5 | 12.7 | 3.5 | 20.37 | 1.1 | 36.57 | 14.3 | 79.39 | |||
| 31-Dec-97 | 4.6 | 11.6 | 4.5 | 20.94 | 13.4 | 36.98 | 10.3 | 90.76 | |||
| 30-Jan-98 | 8.5 | 12.14 | 0.3 | 21.89 | -6.2 | 41.48 | 2.1 | 99.59 | |||
| 27-Feb-98 | -3.6 | 13.17 | 9.7 | 21.97 | 7.6 | 38.9 | -2.6 | 101.72 | |||
| 31-Mar-98 | -6.2 | 12.66 | -1.3 | 24.09 | 1.9 | 41.86 | 8.3 | 99.08 | |||
| 30-Apr-98 | 12.6 | 11.57 | 4.3 | 23.85 | 11.5 | 42.7 | -8.6 | 106.54 | |||
| 29-May-98 | -10.2 | 13.05 | -2.1 | 24.88 | 0.4 | 47.52 | 1.2 | 97.43 | |||
| 30-Jun-98 | -5 | 11.68 | 3.8 | 24.28 | 11.1 | 47.33 | -5.6 | 98.87 | |||
Exhibit 2b
| Exhibit 2 Monthly Returns for Dow 30 Stocks | |||||||||||
| BETHLEHEM STEEL CORP | BOEING CO | CHEVRON CORP | COCA COLA CO | ||||||||
| Return (%) | Market Cap ($ bil) | Return (%) | Market Cap ($ bil) | Return (%) | Market Cap ($ bil) | Return (%) | Market Cap ($ bil) | ||||
| 31-Jan-90 | -2.7 | 1.39 | -0.2 | 13.68 | -1.3 | 23.18 | -10.8 | 26.37 | |||
| 28-Feb-90 | -2.2 | 1.35 | 8.3 | 13.65 | 1.4 | 22.88 | 2.4 | 23.51 | |||
| 30-Mar-90 | 12.1 | 1.31 | 12.3 | 14.72 | 0.6 | 22.96 | 6.6 | 24.06 | |||
| 30-Apr-90 | -17.2 | 1.47 | -2.8 | 16.53 | -2.4 | 23.09 | 2 | 25.19 | |||
| 31-May-90 | 9.1 | 1.22 | 19 | 16.07 | 7.3 | 22.54 | 18.4 | 25.7 | |||
| 29-Jun-90 | -8.5 | 1.32 | 6.2 | 20.22 | 0.5 | 23.95 | -1.2 | 30.42 | |||
| 31-Jul-90 | -15.5 | 1.21 | -1.3 | 20.23 | 13.9 | 24.95 | 2.3 | 29.58 | |||
| 31-Aug-90 | -11.2 | 1.02 | -16 | 19.97 | -4.4 | 28.14 | -6.9 | 30.25 | |||
| 28-Sep-90 | 0 | 0.9 | -13.7 | 16.69 | -2.5 | 26.9 | -6 | 28.16 | |||
| 31-Oct-90 | -5.2 | 0.91 | 7.5 | 14.42 | -7.9 | 26.16 | 13.6 | 26.37 | |||
| 30-Nov-90 | 4.2 | 0.86 | -0.6 | 15.51 | 3.7 | 24.08 | 3.5 | 29.96 | |||
| 31-Dec-90 | 25.5 | 0.89 | 2.5 | 15.33 | 3.9 | 24.7 | 0.5 | 30.87 | |||
| 31-Jan-91 | 0.8 | 1.12 | 8.8 | 15.58 | -1.7 | 25.66 | 4.8 | 31.05 | |||
| 28-Feb-91 | 9.1 | 1.13 | -1.8 | 16.96 | 6.5 | 25.22 | 7.4 | 32.55 | |||
| 28-Mar-91 | -14.7 | 1.22 | -2.6 | 16.57 | 2.3 | 26.59 | 4 | 34.97 | |||
| 30-Apr-91 | 0.9 | 1.04 | -2.7 | 16.14 | 1.6 | 27.21 | -2.8 | 36.23 | |||
| 31-May-91 | 15.1 | 1.05 | 7.4 | 15.71 | -4.5 | 27.34 | 8.5 | 35.22 | |||
| 28-Jun-91 | 1.6 | 1.2 | -6.4 | 16.79 | -4.7 | 26.1 | -4.4 | 38.23 | |||
| 31-Jul-91 | 11.6 | 1.22 | 1.4 | 15.73 | 2.5 | 24.69 | 10.3 | 36.38 | |||
| 30-Aug-91 | -0.1 | 1.37 | 7.8 | 15.94 | 0.6 | 25.31 | 9.4 | 40.13 | |||
| 30-Sep-91 | -5.6 | 1.36 | 2 | 17.1 | 2.4 | 25.17 | -1.5 | 43.89 | |||
| 31-Oct-91 | -9.6 | 1.29 | -3 | 17.43 | 1.7 | 25.77 | 3.3 | 42.98 | |||
| 29-Nov-91 | -25.6 | 1.16 | -9.6 | 16.92 | -9.6 | 26.21 | 4.5 | 44.4 | |||
| 31-Dec-91 | 24.4 | 0.86 | 7.9 | 15.2 | 3.4 | 23.4 | 15.7 | 46.23 | |||
| 31-Jan-92 | 3.6 | 1.07 | 6.5 | 16.39 | -7.8 | 24.14 | -3.4 | 53.36 | |||
| 28-Feb-92 | 2.6 | 1.11 | -9.1 | 17.46 | -1.8 | 22.26 | 5.5 | 51.53 | |||
| 31-Mar-92 | -0.8 | 1.13 | -4.6 | 15.79 | 3.9 | 21.56 | 0.3 | 54.36 | |||
| 30-Apr-92 | -1.7 | 1.12 | 0.3 | 15.06 | 9 | 22.39 | 1.5 | 54.32 | |||
| 29-May-92 | -2.6 | 1.11 | 0.3 | 15.1 | 3.5 | 24.4 | 6 | 55.15 | |||
| 30-Jun-92 | 7.1 | 1.08 | -9.1 | 15.06 | -6.1 | 24.97 | -8.8 | 58.47 | |||
| 31-Jul-92 | -8.3 | 1.16 | 0.3 | 13.61 | 6.5 | 23.23 | 4.7 | 52.7 | |||
| 31-Aug-92 | -13.5 | 1.06 | -6.3 | 13.65 | 4.1 | 24.75 | 2.7 | 55.17 | |||
| 30-Sep-92 | -3.1 | 0.92 | -1.3 | 12.71 | 0.9 | 25.48 | -5.5 | 56.66 | |||
| 30-Oct-92 | 7.5 | 1.05 | -2 | 12.47 | -4.2 | 25.3 | 0.3 | 53.21 | |||
| 30-Nov-92 | 23 | 1.13 | -1.7 | 12.21 | -2 | 24.23 | -1.8 | 53.38 | |||
| 31-Dec-92 | 4.1 | 1.39 | 14.2 | 11.92 | 1.1 | 23.47 | 5.3 | 52.23 | |||
| 29-Jan-93 | 18 | 1.45 | -12.2 | 13.62 | 4.7 | 23.69 | 1.2 | 54.85 | |||
| 26-Feb-93 | -9.9 | 1.71 | -1.8 | 11.96 | 7 | 24.8 | 0 | 55.51 | |||
| 31-Mar-93 | 3.7 | 1.54 | 1.8 | 11.66 | 8 | 26.25 | 1 | 55.51 | |||
| 30-Apr-93 | 11.3 | 1.59 | 8.6 | 11.88 | 3.6 | 28.34 | -7.6 | 55.7 | |||
| 28-May-93 | -1.3 | 1.78 | 4.9 | 12.89 | 3.3 | 29.36 | 5.4 | 51.45 | |||
| 30-Jun-93 | -3.2 | 1.75 | -6.6 | 13.45 | -0.4 | 30.04 | 4 | 54.23 | |||
| 30-Jul-93 | -22.7 | 1.7 | 6.4 | 12.57 | 0.7 | 28.54 | 0.6 | 56.19 | |||
| 31-Aug-93 | -6.9 | 1.31 | 1.3 | 13.37 | 6.4 | 28.75 | 0.3 | 56.52 | |||
| 30-Sep-93 | 6.5 | 1.22 | -3.2 | 13.46 | 5 | 30.29 | -2.2 | 56.68 | |||
| 29-Oct-93 | 15.7 | 1.31 | -2.3 | 13.04 | -0.8 | 31.82 | 2.7 | 54.94 | |||
| 30-Nov-93 | 4.5 | 1.51 | 3.7 | 12.74 | -9.5 | 31.57 | -2.8 | 56.41 | |||
| 31-Dec-93 | 17.3 | 1.58 | 12 | 13.12 | 0.3 | 28.28 | 6.3 | 54.62 | |||
| 31-Jan-94 | 14.7 | 1.86 | 0 | 14.69 | 7.2 | 28.37 | -8.4 | 57.96 | |||
| 28-Feb-94 | -7 | 2.13 | 8.7 | 14.69 | -6.2 | 30.41 | 4.3 | 53.09 | |||
| 31-Mar-94 | -8.6 | 1.99 | -4.8 | 15.88 | -3 | 28.21 | -4.2 | 55.36 | |||
| 29-Apr-94 | 1.3 | 2.12 | 1.1 | 15.12 | 6 | 27.35 | 2.8 | 52.71 | |||
| 31-May-94 | -4.3 | 2.14 | 3.6 | 15.31 | -1.2 | 28.98 | -3.6 | 54.17 | |||
| 30-Jun-94 | -3.2 | 2.05 | -0.3 | 15.79 | -3.7 | 27.28 | 1.4 | 52.22 | |||
| 29-Jul-94 | 19.5 | 1.98 | -3.5 | 15.75 | 6 | 27.29 | 9.2 | 52.54 | |||
| 31-Aug-94 | 3.4 | 2.43 | 2.5 | 15.19 | -3.5 | 28.92 | 3.7 | 57.39 | |||
| 30-Sep-94 | -8.7 | 2.51 | -4.9 | 15.5 | -1.8 | 27.61 | 6.1 | 59.49 | |||
| 31-Oct-94 | -8.9 | 2.29 | 1.4 | 14.74 | 8.1 | 27.13 | 3.6 | 62.71 | |||
| 30-Nov-94 | -7.2 | 2.09 | 2.8 | 14.95 | -2 | 29.33 | 1.9 | 64.97 | |||
| 30-Dec-94 | 1.4 | 1.95 | 4.7 | 15.29 | 2.3 | 28.43 | 0.7 | 65.73 | |||
| 31-Jan-95 | -13.2 | 1.98 | -5.3 | 16.02 | 0 | 29.08 | 1.9 | 66.22 | |||
| 28-Feb-95 | 0.8 | 1.72 | 4.2 | 15.16 | 7.8 | 29.08 | 4.8 | 67.5 | |||
| 31-Mar-95 | 2.4 | 1.73 | 16.5 | 15.72 | 0.8 | 31.04 | 2.9 | 70.72 | |||
| 28-Apr-95 | -12.4 | 1.77 | 2.3 | 18.33 | -1.3 | 31.28 | 3.1 | 71.73 | |||
| 31-May-95 | 4.4 | 1.55 | 7.5 | 18.75 | 4.7 | 30.87 | 6 | 73.96 | |||
| 30-Jun-95 | 10.2 | 1.62 | 6.4 | 20.11 | -5.6 | 32.02 | 3.8 | 78.11 | |||
| 31-Jul-95 | -3.1 | 1.79 | 7 | 21.39 | 6.5 | 30.24 | 2.9 | 80.8 | |||
| 31-Aug-95 | -7.1 | 1.73 | -4.1 | 22.88 | -1 | 32.19 | -2.1 | 83.18 | |||
| 29-Sep-95 | -3.4 | 1.62 | 6.6 | 21.92 | 0.8 | 31.54 | 7.7 | 81.44 | |||
| 31-Oct-95 | -7.1 | 1.56 | -4 | 23.37 | -4.1 | 31.79 | 4.2 | 87.02 | |||
| 30-Nov-95 | 6.7 | 1.45 | 11.6 | 22.43 | 6.7 | 30.48 | 5.7 | 90.65 | |||
| 29-Dec-95 | -0.9 | 1.58 | 7.5 | 25.01 | 6.1 | 32.2 | -2 | 95.02 | |||
| 31-Jan-96 | 9 | 1.56 | -1.1 | 26.89 | -1 | 34.16 | 1.5 | 93.14 | |||
| 29-Feb-96 | -9.1 | 1.7 | 5 | 26.59 | 8.2 | 33.83 | 7.1 | 94.55 | |||
| 29-Mar-96 | -4.5 | 1.55 | 6.8 | 27.84 | 0.9 | 36.28 | 2.8 | 101.29 | |||
| 30-Apr-96 | 4.8 | 1.48 | -5.2 | 29.84 | 3.3 | 36.61 | -1.5 | 103.5 | |||
| 31-May-96 | -7.3 | 1.52 | 4.1 | 28.29 | 3.9 | 37.85 | 12.9 | 101.94 | |||
| 28-Jun-96 | -6.9 | 1.41 | 2.2 | 29.37 | -1.3 | 39 | 6.8 | 115.07 | |||
| 31-Jul-96 | -14.7 | 1.32 | 1.6 | 30.15 | -1.9 | 38.51 | -4.3 | 122.31 | |||
| 30-Aug-96 | 1.2 | 1.12 | 2.6 | 30.63 | 2.7 | 37.77 | 7.2 | 117 | |||
| 30-Sep-96 | -2.4 | 1.14 | 4.4 | 31.54 | 6.4 | 38.43 | 1.5 | 125.43 | |||
| 31-Oct-96 | -18.8 | 1.11 | 0.9 | 32.93 | 5 | 40.88 | -0.7 | 126.83 | |||
| 29-Nov-96 | 10.8 | 0.91 | 4.5 | 33.24 | 2.7 | 42.92 | 1.5 | 125.9 | |||
| 31-Dec-96 | -1.4 | 1 | 7.2 | 34.63 | -3 | 43.73 | 2.9 | 127.45 | |||
| 31-Jan-97 | -5.6 | 0.99 | 0.6 | 37.19 | 2.1 | 42.41 | 10 | 130.94 | |||
| 28-Feb-97 | -1.5 | 0.94 | -4.8 | 37.4 | -2 | 43.3 | 5.4 | 144 | |||
| 31-Mar-97 | 0 | 0.92 | -3.1 | 36.46 | 7.9 | 42.08 | -8.4 | 151.78 | |||
| 30-Apr-97 | 0 | 0.92 | 0 | 35.56 | -1.6 | 45.42 | 14.1 | 138.71 | |||
| 30-May-97 | 21.2 | 0.92 | 7.1 | 35.56 | 3 | 44.75 | 7.7 | 158.31 | |||
| 30-Jun-97 | 4.4 | 1.12 | 0.7 | 38.26 | 5.6 | 45.74 | -0.5 | 169.81 | |||
| 31-Jul-97 | 7.8 | 1.17 | 10.6 | 38.25 | 6.8 | 48.32 | 1.7 | 168.57 | |||
| 29-Aug-97 | 6.7 | 1.26 | -6.9 | 40.8 | -1.2 | 51.62 | -17.1 | 171.36 | |||
| 30-Sep-97 | -14.1 | 1.35 | -0.1 | 54.57 | 7.3 | 50.7 | 6.7 | 142.15 | |||
| 31-Oct-97 | -3 | 1.16 | -11.8 | 54.51 | -0.2 | 54.38 | -7.2 | 151.3 | |||
| 28-Nov-97 | 2.5 | 1.13 | 11 | 48.06 | -2.6 | 54.3 | 10.6 | 140.45 | |||
| 31-Dec-97 | -15.2 | 1.16 | -7.9 | 53.19 | -4 | 52.66 | 6.7 | 154.58 | |||
| 30-Jan-98 | 13.7 | 0.98 | -2.7 | 48.92 | -2.9 | 50.57 | -2.9 | 164.93 | |||
| 27-Feb-98 | 7.6 | 1.11 | 14.2 | 47.61 | 9 | 49.09 | 6 | 160.14 | |||
| 31-Mar-98 | 27.6 | 1.2 | -3.9 | 54.23 | -0.7 | 53.11 | 13.1 | 169.72 | |||
| 30-Apr-98 | 14.7 | 1.53 | -4 | 50.74 | 3 | 52.48 | -2 | 191.38 | |||
| 29-May-98 | -21.3 | 1.76 | -4.3 | 48.73 | -2.7 | 54.03 | 3.3 | 187.52 | |||
| 30-Jun-98 | 1.5 | 1.39 | -6.7 | 48.24 | 4.9 | 52.24 | 9.3 | 193.53 | |||
Exhibit 2c
| Exhibit 2 Monthly Returns for Dow 30 Stocks | |||||||||||||||
| DU PONT | EASTMAN KODAK CO | EXXON CORP | GENERAL ELECTRIC CO | GENERAL MOTORS CORP | |||||||||||
| Return (%) | Market Cap ($ bil) | Return (%) | Market Cap ($ bil) | Return (%) | Market Cap ($ bil) | Return (%) | Market Cap ($ bil) | Return (%) | Market Cap ($ bil) | ||||||
| 31-Jan-90 | -7.6 | 28.77 | -7.3 | 13.34 | -6 | 62.58 | -3.5 | 58.2 | -1.5 | 25.44 | |||||
| 28-Feb-90 | 4.7 | 26.58 | 0 | 12.37 | 1.3 | 58.83 | 0 | 56.17 | 9.6 | 25.06 | |||||
| 30-Mar-90 | -2.2 | 27.54 | 4 | 12.21 | -1.9 | 58.83 | 4 | 55.72 | 2.2 | 27.02 | |||||
| 30-Apr-90 | -2.9 | 26.36 | -5.8 | 12.69 | -1.9 | 57.66 | -0.4 | 57.75 | -3.5 | 27.62 | |||||
| 31-May-90 | 8.1 | 25.59 | 10.5 | 11.96 | 7.4 | 56.56 | 8.4 | 57.52 | 11.6 | 26.64 | |||||
| 29-Jun-90 | -3.4 | 27.39 | 0.6 | 13.06 | -0.3 | 60 | 0.5 | 61.9 | -2.1 | 29.28 | |||||
| 31-Jul-90 | 7.8 | 26.12 | -5.9 | 13.15 | 8.4 | 59.84 | 3.4 | 62.13 | -2.1 | 28.67 | |||||
| 31-Aug-90 | -12.3 | 28.15 | 6.9 | 12.37 | -2.5 | 64.84 | -13.4 | 64.26 | -13.1 | 28.07 | |||||
| 28-Sep-90 | -5.9 | 24.42 | -4.3 | 13.06 | -2 | 62.5 | -11.3 | 55.62 | -8.8 | 23.93 | |||||
| 31-Oct-90 | -2.2 | 22.88 | 3.2 | 12.49 | 0 | 61.11 | -4.6 | 48.43 | 1.4 | 21.82 | |||||
| 30-Nov-90 | 12.6 | 22.38 | 7.9 | 12.9 | 4.7 | 61.11 | 5.3 | 46.21 | 1.4 | 22.12 | |||||
| 31-Dec-90 | -0.3 | 24.91 | -1.8 | 13.75 | 2.2 | 63.13 | 5.7 | 48.65 | -5.8 | 21.97 | |||||
| 31-Jan-91 | -1.4 | 24.64 | 2.4 | 13.51 | -0.2 | 64.49 | 11.5 | 50.34 | 5.5 | 20.63 | |||||
| 28-Feb-91 | 5 | 24.3 | 3.8 | 13.83 | 8.1 | 64.33 | 7 | 56.16 | 10.1 | 21.75 | |||||
| 28-Mar-91 | -1.3 | 25.23 | -0.3 | 14.2 | 6.1 | 68.7 | 2.4 | 59.67 | -4.4 | 23.7 | |||||
| 30-Apr-91 | 12.1 | 24.89 | -4.6 | 14.15 | 1.7 | 72.83 | 1.6 | 61.09 | -5.3 | 22.86 | |||||
| 31-May-91 | 14.5 | 27.91 | 3 | 13.51 | -1 | 74.08 | 9.9 | 62.08 | 21.7 | 21.65 | |||||
| 28-Jun-91 | -2.9 | 31.68 | -8.6 | 13.75 | -0.2 | 72.52 | -4.2 | 67.78 | -5.5 | 26.12 | |||||
| 31-Jul-91 | 6.5 | 30.76 | 5.8 | 12.57 | 2.2 | 72.35 | -1 | 64.42 | -2.5 | 24.95 | |||||
| 30-Aug-91 | -0.4 | 32.77 | 6.4 | 13.31 | -0.8 | 73.91 | 2.2 | 63.77 | -3.4 | 24.33 | |||||
| 30-Sep-91 | -6.5 | 32.35 | -1.2 | 13.99 | 2.1 | 72.51 | -6.7 | 65.19 | -1.6 | 23.26 | |||||
| 31-Oct-91 | 5.5 | 30.28 | 5.9 | 13.83 | 2.5 | 74.01 | -0.5 | 60.37 | -6 | 23 | |||||
| 29-Nov-91 | -5.9 | 31.96 | 4.4 | 14.65 | -2.8 | 75.87 | -6.2 | 60.05 | -11.3 | 21.61 | |||||
| 31-Dec-91 | 5.1 | 29.77 | 3.5 | 15.13 | 3.8 | 72.92 | 19 | 56.35 | -6.1 | 18.92 | |||||
| 31-Jan-92 | -0.3 | 31.29 | 4.7 | 15.67 | -4.3 | 75.65 | -1.6 | 66.29 | 12.1 | 17.78 | |||||
| 28-Feb-92 | 0.4 | 31.21 | -10.6 | 16.4 | -0.8 | 72.39 | 4.5 | 65.21 | 17.1 | 19.94 | |||||
| 31-Mar-92 | 3 | 31.04 | -9 | 14.49 | -4.2 | 70.99 | -3 | 68.14 | -2.3 | 23.09 | |||||
| 30-Apr-92 | 13.9 | 31.96 | -2.5 | 13.2 | 9.6 | 68 | 1.2 | 65.46 | 13.3 | 22.55 | |||||
| 29-May-92 | -2 | 36.41 | 1.9 | 12.88 | 2.2 | 74.52 | -0.3 | 66.21 | -3.9 | 25.56 | |||||
| 30-Jun-92 | -4.3 | 35.4 | 0.6 | 12.96 | 2.1 | 75.3 | 2.5 | 66 | 11.3 | 24.55 | |||||
| 31-Jul-92 | 6.2 | 33.98 | 8.4 | 13.04 | 2.6 | 76.85 | -1.6 | 66.72 | -5.4 | 30.23 | |||||
| 31-Aug-92 | -7.1 | 36.08 | 2.9 | 14.14 | 2.3 | 78.87 | -3.3 | 65.64 | -15.9 | 28.6 | |||||
| 30-Sep-92 | -4.6 | 33.22 | 0.6 | 14.38 | -0.6 | 79.8 | 6.5 | 63.5 | -7.2 | 23.79 | |||||
| 30-Oct-92 | 2.7 | 31.71 | -8.1 | 14.46 | -4.1 | 79.3 | -1.9 | 66.85 | -4.3 | 22.15 | |||||
| 30-Nov-92 | 0.4 | 32.55 | 3.7 | 13.29 | -1.7 | 76.04 | 8.5 | 65.57 | 5.5 | 21.2 | |||||
| 31-Dec-92 | -2.1 | 32.38 | -3.3 | 13.61 | 2.7 | 73.87 | 3.5 | 71.12 | 0 | 22.24 | |||||
| 29-Jan-93 | -2.9 | 31.78 | 23.1 | 13.17 | 0 | 75.88 | 0.7 | 73.02 | 17.1 | 22.74 | |||||
| 26-Feb-93 | 2.3 | 30.86 | 8.5 | 16.22 | 5.3 | 75.88 | -2.3 | 73.55 | -0.8 | 26.62 | |||||
| 31-Mar-93 | 4 | 31.28 | 1.2 | 17.44 | 3.9 | 78.99 | 6.7 | 71.85 | 1 | 26.27 | |||||
| 30-Apr-93 | 8 | 32.54 | -10.1 | 17.64 | -0.2 | 82.13 | 1.7 | 76.12 | 8.6 | 26.53 | |||||
| 28-May-93 | 2 | 35.16 | 7.2 | 15.85 | 0.3 | 81.97 | 2.3 | 77.4 | -1.3 | 28.83 | |||||
| 30-Jun-93 | -10.7 | 35.58 | -3.4 | 16.83 | 1 | 81.35 | 3.9 | 79.21 | 10.9 | 28.3 | |||||
| 30-Jul-93 | -0.5 | 31.81 | 7.3 | 16.38 | -0.8 | 82.13 | 2.9 | 81.83 | 9 | 31.45 | |||||
| 31-Aug-93 | 4.7 | 31.64 | 14.7 | 17.57 | 0.7 | 81.51 | -0.3 | 84.18 | -2.9 | 34.28 | |||||
| 30-Sep-93 | -4.4 | 32.82 | -2.7 | 19.98 | 0.2 | 81.2 | -1.8 | 83.96 | -10.9 | 33.13 | |||||
| 29-Oct-93 | 2.4 | 31.48 | 5.9 | 19.47 | -0.2 | 81.33 | 1.2 | 81.89 | 14.1 | 29.55 | |||||
| 30-Nov-93 | 1.2 | 32.24 | -2.4 | 20.62 | -2.9 | 81.18 | 1.4 | 82.85 | 11.2 | 33.71 | |||||
| 31-Dec-93 | 1 | 32.33 | -7.6 | 20.06 | 0.6 | 77.91 | 7.3 | 84.03 | 4 | 37.33 | |||||
| 31-Jan-94 | 16.3 | 32.68 | -2.3 | 18.54 | 5.3 | 78.38 | 2.7 | 89.45 | 11.6 | 38.99 | |||||
| 28-Feb-94 | -4.3 | 38.01 | -1.6 | 14.54 | -1.4 | 82.57 | -2.2 | 91.9 | -4.6 | 43.52 | |||||
| 31-Mar-94 | -0.5 | 36.07 | 3.2 | 14.17 | -3.1 | 80.55 | -4.4 | 89.88 | -7.5 | 41.39 | |||||
| 29-Apr-94 | 7.8 | 35.9 | -6.5 | 14.67 | 0 | 78.09 | -4.8 | 85.38 | 5.3 | 38.28 | |||||
| 31-May-94 | 9.3 | 38.69 | 13.9 | 13.72 | -1.6 | 78.09 | 4.5 | 81.33 | -4.9 | 41.25 | |||||
| 30-Jun-94 | -6 | 42.08 | 2.7 | 15.5 | -7.2 | 75.92 | -5.6 | 84.96 | -6.5 | 39.07 | |||||
| 29-Jul-94 | 1.9 | 39.59 | 0.5 | 15.91 | 4.8 | 70.47 | 8 | 79.75 | 2.2 | 37.42 | |||||
| 31-Aug-94 | 2.7 | 40.36 | 3.7 | 16.09 | 1.2 | 73.89 | -1.2 | 86.16 | -1.8 | 38.26 | |||||
| 30-Sep-94 | -4.1 | 41.12 | 4 | 16.55 | -3.4 | 73.89 | -2.5 | 85.19 | -6.7 | 37.42 | |||||
| 31-Oct-94 | 2.8 | 39.47 | -7 | 17.55 | 9.3 | 71.38 | 1.6 | 82.41 | -15.7 | 35.16 | |||||
| 30-Nov-94 | -8.9 | 40.58 | -4.6 | 16.32 | -2.8 | 78.05 | -5.9 | 83.69 | -3 | 29.63 | |||||
| 30-Dec-94 | 4.2 | 36.68 | 4.9 | 15.43 | 0.6 | 74.95 | 11.8 | 78.64 | 10.5 | 28.73 | |||||
| 31-Jan-95 | -5.1 | 38.22 | 2.6 | 16.22 | 2.9 | 75.42 | 1 | 87.19 | -7.7 | 31.74 | |||||
| 28-Feb-95 | 6.3 | 36.26 | 4.9 | 16.64 | 3.4 | 77.59 | 6.3 | 88.05 | 10.2 | 29.29 | |||||
| 31-Mar-95 | 7.8 | 38.22 | 4.4 | 17.32 | 4.3 | 79.3 | -0.6 | 93.6 | 3.2 | 32.12 | |||||
| 28-Apr-95 | 8.9 | 41.22 | 8 | 18.09 | 4.3 | 82.73 | 3.7 | 92.32 | 2.6 | 33.16 | |||||
| 31-May-95 | 3.8 | 34.6 | 5.7 | 19.54 | 3.8 | 86.3 | 3.6 | 95.74 | 7 | 34.04 | |||||
| 30-Jun-95 | 1.3 | 37.51 | 0.4 | 20.55 | -1.1 | 88.63 | -2.1 | 98.4 | -2.3 | 36.21 | |||||
| 31-Jul-95 | -2.5 | 37.38 | -4.9 | 20.63 | 2.7 | 87.73 | 4.7 | 95.49 | 4 | 35.04 | |||||
| 31-Aug-95 | -1.6 | 36.43 | 0.9 | 19.61 | -4.1 | 90.06 | -0.2 | 99.94 | -2.7 | 36.44 | |||||
| 29-Sep-95 | 5.2 | 36.28 | 2.6 | 19.74 | 5.1 | 85.4 | 9 | 99.73 | -0.5 | 35.22 | |||||
| 31-Oct-95 | -9.3 | 38.15 | 5.7 | 20.25 | 5.7 | 89.72 | -0.8 | 107.25 | -6.7 | 35.03 | |||||
| 30-Nov-95 | 7.4 | 34.62 | 9.6 | 21.41 | 2.3 | 94.84 | 6.1 | 106.41 | 11.5 | 32.7 | |||||
| 29-Dec-95 | 5.1 | 36.93 | -1.8 | 23.33 | 4.8 | 96.08 | 7.9 | 112.12 | 9 | 36.35 | |||||
| 31-Jan-96 | 9.8 | 38.8 | 9.5 | 22.92 | -1.1 | 100.73 | 6.6 | 120.26 | -0.5 | 39.62 | |||||
| 29-Feb-96 | 0.4 | 42.62 | -2 | 25.1 | 0 | 99.64 | -1.6 | 128.19 | -1.9 | 39.44 | |||||
| 29-Mar-96 | 8.5 | 42.48 | -0.7 | 24.46 | 2.5 | 98.71 | 3.8 | 126.11 | 3.9 | 38.41 | |||||
| 30-Apr-96 | -3.3 | 46.09 | 7.7 | 24.56 | 4.3 | 101.23 | -0.8 | 130.07 | 1.9 | 39.91 | |||||
| 31-May-96 | 0.1 | 44.86 | -2.3 | 26.46 | 0.6 | 105.58 | 7.1 | 128.43 | 2.4 | 41.01 | |||||
| 28-Jun-96 | -0.8 | 44.7 | 4.5 | 25.73 | 2.5 | 105.27 | 4.8 | 137.57 | -5 | 41.67 | |||||
| 31-Jul-96 | 2.1 | 44.35 | -4 | 26.89 | -5.3 | 107.91 | -4.7 | 144.22 | -6.9 | 39.59 | |||||
| 30-Aug-96 | 2.4 | 45.26 | -2.3 | 25.34 | 0 | 102.16 | 1.1 | 136.51 | 2.6 | 36.85 | |||||
| 30-Sep-96 | 7.3 | 46.08 | 8.3 | 24.43 | 2.1 | 101.23 | 10 | 137.97 | -3.3 | 37.51 | |||||
| 31-Oct-96 | 5.2 | 49.44 | 1.4 | 26.45 | 6.5 | 103.38 | 6.3 | 150.26 | 11.7 | 36.28 | |||||
| 29-Nov-96 | 2.2 | 52.04 | 2.4 | 26.83 | 7.4 | 110.06 | 7.5 | 159.76 | 8.2 | 40.54 | |||||
| 31-Dec-96 | -0.1 | 53.06 | -1.1 | 27.03 | 3.8 | 117.19 | -4.4 | 171.73 | -3.3 | 43.56 | |||||
| 31-Jan-97 | 16.5 | 52.99 | 8.1 | 26.74 | 5.7 | 121.69 | 4.7 | 162.79 | 5.8 | 42.15 | |||||
| 28-Feb-97 | -1.6 | 61.72 | 4 | 28.91 | -2.5 | 128.68 | -0.6 | 170.4 | -1.1 | 44.61 | |||||
| 31-Mar-97 | -1.2 | 60.38 | -15.3 | 29.91 | 7.5 | 124.49 | -3 | 169.38 | -4.3 | 43.75 | |||||
| 30-Apr-97 | 0.1 | 59.68 | 9.4 | 25.22 | 5.1 | 133.84 | 11.8 | 163.41 | 4.5 | 41.16 | |||||
| 30-May-97 | 2.9 | 60.03 | 0.2 | 27.58 | 5.4 | 140.68 | 8.8 | 198.05 | 0 | 43.01 | |||||
| 30-Jun-97 | 15.8 | 71.14 | -7.4 | 27.5 | 3.4 | 147.12 | 7.7 | 197.21 | -2.8 | 42.64 | |||||
| 31-Jul-97 | 6.7 | 70.98 | -12.7 | 25.25 | 4.9 | 152.09 | 8.3 | 212.31 | 11 | 40.65 | |||||
| 29-Aug-97 | -6.6 | 75.71 | -1.8 | 22.04 | -4.1 | 159.53 | -10.8 | 229.03 | 2.2 | 45.11 | |||||
| 30-Sep-97 | -1.2 | 70.35 | -0.7 | 21.3 | 4.7 | 151.4 | 9.2 | 204.34 | 6.7 | 45.19 | |||||
| 31-Oct-97 | -7.6 | 69.5 | -7.8 | 21.16 | -4.1 | 158.52 | -5.1 | 222.3 | -4.1 | 48.21 | |||||
| 28-Nov-97 | 7 | 64.32 | 2 | 19.51 | 0 | 152.02 | 14.3 | 211.5 | -4.3 | 46.23 | |||||
| 31-Dec-97 | -0.8 | 68.49 | -0.1 | 19.75 | 0.3 | 150.42 | -0.3 | 241.77 | 5.8 | 43.89 | |||||
| 30-Jan-98 | -5.7 | 67.92 | 7.7 | 19.68 | -3.1 | 150.88 | 5.6 | 240.14 | -4.6 | 42.97 | |||||
| 27-Feb-98 | 8.8 | 64.03 | 1.2 | 21.2 | 8.2 | 146.26 | 0.3 | 253.64 | 19.8 | 40.98 | |||||
| 31-Mar-98 | 10.9 | 69.34 | -1.1 | 21.32 | 6.1 | 157.2 | 11.2 | 254.45 | -1.7 | 48.76 | |||||
| 30-Apr-98 | 7.1 | 76.54 | 11.3 | 20.97 | 8 | 165.66 | -1.2 | 281.01 | -0.6 | 45.97 | |||||
| 29-May-98 | 6.5 | 81.96 | -0.5 | 23.33 | -2.9 | 178.98 | -2.1 | 277.75 | 7.4 | 45.72 | |||||
| 30-Jun-98 | -3.2 | 87.11 | 2.4 | 23.03 | 1.2 | 172.5 | 9 | 271.64 | -7 | 48.04 | |||||
Exhibit 2d
| Exhibit 2 Monthly Returns for Dow 30 Stocks | ||||||||||||||
| GOODYEAR TIRE & RUBR CO | INT BUSINESS MACHS CORP | INTERNATIONAL PAPER CO | NAVISTAR INT CORP | MCDONALDS CORP | ||||||||||
| Return (%) | Market Cap ($ bil) | Return (%) | Market Cap ($ bil) | Return (%) | Market Cap ($ bil) | Return (%) | Market Cap ($ bil) | Return (%) | Market Cap ($ bil) | |||||
| 31-Jan-90 | -17.2 | 2.51 | 4.8 | 54.48 | -10.6 | 6.15 | 0 | 0.97 | -5.4 | 12.76 | ||||
| 28-Feb-90 | -5 | 2.08 | 6.6 | 57.09 | 0.8 | 5.5 | -9.7 | 0.97 | -3.2 | 12.07 | ||||
| 30-Mar-90 | 5.9 | 1.95 | 2.2 | 60.13 | 0 | 5.5 | 17.9 | 0.88 | 0.8 | 11.65 | ||||
| 30-Apr-90 | -1 | 2.07 | 2.7 | 60.99 | -1.7 | 5.49 | -6.1 | 1.04 | -4.7 | 11.75 | ||||
| 31-May-90 | 2.3 | 2.04 | 11.2 | 62.64 | 6.6 | 5.39 | 6.5 | 0.98 | 14.7 | 11.19 | ||||
| 29-Jun-90 | -15.7 | 2.07 | -2.1 | 68.96 | -3.1 | 5.71 | 0 | 1.04 | 2.5 | 12.81 | ||||
| 31-Jul-90 | -12 | 1.74 | -5.1 | 67.53 | 10.8 | 5.53 | -9.1 | 1.04 | -11.6 | 12.85 | ||||
| 31-Aug-90 | -12.5 | 1.53 | -7.5 | 64.08 | -14.8 | 6.13 | -16.7 | 0.94 | -10.9 | 11.36 | ||||
| 28-Sep-90 | -25.3 | 1.32 | 4.4 | 58.55 | -8.7 | 5.18 | -16 | 0.79 | -6.7 | 10.09 | ||||
| 31-Oct-90 | -10.3 | 0.99 | -0.9 | 60.94 | 6.9 | 4.75 | -19 | 0.66 | -2.9 | 9.32 | ||||
| 30-Nov-90 | 7.9 | 0.89 | 9 | 60.36 | 6.8 | 5.08 | -5.9 | 0.53 | 11.7 | 9.05 | ||||
| 31-Dec-90 | 18 | 0.93 | -0.6 | 65.09 | 8.6 | 5.38 | 12.5 | 0.5 | 3.6 | 10.08 | ||||
| 31-Jan-91 | 7.3 | 1.1 | 12.2 | 64.53 | 10 | 5.86 | 27.8 | 0.56 | -2.1 | 10.45 | ||||
| 28-Feb-91 | 2.3 | 1.18 | 2.5 | 72.38 | 5 | 6.45 | 21.7 | 0.72 | 11 | 10.23 | ||||
| 28-Mar-91 | 14.5 | 1.2 | -11.6 | 73.52 | -0.6 | 6.72 | 10.7 | 0.88 | 10.2 | 11.35 | ||||
| 30-Apr-91 | -10.1 | 1.38 | -9.6 | 65.07 | 3.1 | 6.68 | -6.5 | 0.97 | -3.6 | 12.47 | ||||
| 31-May-91 | 24 | 1.24 | 4.2 | 58.85 | 13 | 6.88 | 3.4 | 0.91 | 4.8 | 12.02 | ||||
| 28-Jun-91 | 26.7 | 1.54 | -8.5 | 60.64 | -0.2 | 7.73 | -6.7 | 0.94 | -6.1 | 12.56 | ||||
| 31-Jul-91 | 14.7 | 1.95 | 4.2 | 55.5 | -1.4 | 7.73 | -10.7 | 0.88 | -0.4 | 11.81 | ||||
| 30-Aug-91 | 0.6 | 2.23 | -3.1 | 57.85 | 0.8 | 7.62 | 0 | 0.78 | -0.1 | 11.76 | ||||
| 30-Sep-91 | 14.7 | 2.24 | 7 | 55.35 | -2.2 | 7.64 | -4 | 0.78 | 7.3 | 11.72 | ||||
| 31-Oct-91 | 14 | 2.57 | -5.2 | 59.29 | 11.6 | 7.55 | -8.3 | 0.75 | -0.7 | 12.5 | ||||
| 29-Nov-91 | -4.1 | 2.93 | -4.6 | 56.21 | -11.6 | 8.43 | 0 | 0.69 | -3 | 12.41 | ||||
| 31-Dec-91 | 11.7 | 3.77 | -3.8 | 52.92 | 6 | 7.4 | -4.5 | 0.69 | 13 | 12.01 | ||||
| 31-Jan-92 | 12.9 | 3.78 | 1.1 | 50.87 | 2.1 | 7.86 | 23.8 | 0.66 | 14.5 | 13.57 | ||||
| 28-Feb-92 | 6.8 | 4.26 | -2.1 | 51.44 | 2.8 | 8.02 | 23.1 | 0.81 | -6.7 | 15.54 | ||||
| 31-Mar-92 | 1.4 | 4.55 | -3.9 | 49.66 | -0.3 | 8.21 | -9.4 | 1 | -1.5 | 14.46 | ||||
| 30-Apr-92 | 11.3 | 4.61 | 8.7 | 47.73 | 1.2 | 8.77 | -10.3 | 0.91 | 11.3 | 14.24 | ||||
| 29-May-92 | -2.1 | 5.13 | 1.3 | 51.87 | -4.8 | 8.87 | -11.5 | 0.81 | 5.9 | 15.85 | ||||
| 30-Jun-92 | -3.3 | 5.02 | 7.9 | 51.87 | -0.9 | 8.39 | -8.7 | 0.72 | -1.9 | 16.74 | ||||
| 31-Jul-92 | -0.9 | 4.87 | -3.2 | 55.86 | -4.5 | 8.53 | 0 | 0.66 | -4.6 | 16.54 | ||||
| 31-Aug-92 | -7 | 4.82 | -7.3 | 54.08 | -6.1 | 8.14 | -28.6 | 0.66 | -2.9 | 15.78 | ||||
| 30-Sep-92 | -3.4 | 4.48 | -6.8 | 49.44 | 2.6 | 7.6 | 13.3 | 0.47 | 4.4 | 15.28 | ||||
| 30-Oct-92 | 13.1 | 4.37 | -17.2 | 46.09 | 1.4 | 7.79 | -11.8 | 0.53 | 3.4 | 15.98 | ||||
| 30-Nov-92 | 4.5 | 4.94 | 3.9 | 38.17 | 1.4 | 7.9 | 6.7 | 0.47 | 7 | 16.52 | ||||
| 31-Dec-92 | -4.9 | 5.15 | -26.2 | 38.95 | 2.1 | 7.96 | 12.5 | 0.5 | -0.5 | 17.65 | ||||
| 29-Jan-93 | -0.5 | 4.9 | 2.2 | 28.77 | -3.2 | 8.15 | 33.3 | 0.57 | -0.3 | 17.74 | ||||
| 26-Feb-93 | -0.7 | 4.87 | 6.6 | 29.41 | 0.3 | 7.89 | -4.2 | 0.76 | 4.3 | 17.69 | ||||
| 31-Mar-93 | 11.3 | 4.82 | -6.4 | 31.05 | -2.7 | 7.86 | -13 | 0.73 | 4.4 | 18.42 | ||||
| 30-Apr-93 | -0.3 | 5.37 | -4.4 | 29.08 | 5.2 | 7.65 | 0 | 0.59 | -9 | 19.24 | ||||
| 28-May-93 | 6.9 | 5.7 | 9.6 | 27.8 | 2.2 | 8.05 | 10 | 0.59 | 3.4 | 17.51 | ||||
| 30-Jun-93 | 6.9 | 5.7 | -6.4 | 30.15 | -4.1 | 8.17 | -9.1 | 0.64 | -1 | 18.1 | ||||
| 30-Jul-93 | -1.8 | 6.18 | -9.9 | 28.22 | -0.4 | 7.85 | 6.5 | 0.64 | 4.8 | 17.8 | ||||
| 31-Aug-93 | 2.2 | 6.07 | 3.4 | 25.44 | 2.8 | 7.82 | -10.3 | 0.68 | 4.6 | 18.67 | ||||
| 30-Sep-93 | 2.6 | 6.18 | -8.2 | 26.15 | -7.5 | 7.99 | -0.5 | 1.22 | -3.5 | 19.48 | ||||
| 29-Oct-93 | 2.6 | 6.38 | 9.5 | 23.98 | -1.2 | 7.43 | 14.2 | 1.21 | 11.1 | 18.34 | ||||
| 30-Nov-93 | -0.2 | 6.55 | 17.7 | 26.27 | 12.9 | 7.34 | -7.4 | 1.39 | 1.9 | 20.37 | ||||
| 31-Dec-93 | 2.8 | 6.51 | 4.9 | 30.77 | 1.5 | 8.24 | -6 | 1.29 | -2.8 | 20.73 | ||||
| 31-Jan-94 | 5.7 | 6.86 | 0 | 32.68 | 10.9 | 8.37 | 10.1 | 1.21 | 6.6 | 20.12 | ||||
| 28-Feb-94 | -6.2 | 7.26 | -6 | 32.68 | -2.8 | 9.28 | -7.2 | 1.9 | 0 | 21.45 | ||||
| 31-Mar-94 | -10.5 | 6.79 | 3.3 | 30.58 | -6.5 | 8.97 | -7.8 | 1.81 | -6.2 | 21.4 | ||||
| 29-Apr-94 | -3.7 | 6.08 | 5.3 | 31.6 | -3.9 | 8.39 | -15.2 | 1.67 | 5.5 | 20.08 | ||||
| 31-May-94 | -0.1 | 5.87 | 10 | 33.26 | 6.8 | 8.08 | -11.9 | 1.42 | 3.3 | 21.18 | ||||
| 30-Jun-94 | -7.1 | 5.83 | -6.7 | 36.63 | -4.3 | 8.58 | -19.5 | 1.25 | -6.7 | 21.94 | ||||
| 29-Jul-94 | -1 | 5.44 | 5.3 | 34.26 | 10 | 8.26 | -2.8 | 1 | -6.1 | 20.44 | ||||
| 31-Aug-94 | -1.2 | 5.39 | 11.1 | 36.08 | 6.4 | 9.08 | 26 | 0.98 | 4.4 | 19.2 | ||||
| 30-Sep-94 | -4.6 | 5.3 | 1.6 | 39.94 | 1.8 | 9.61 | -15.3 | 1.23 | -6.6 | 19.99 | ||||
| 31-Oct-94 | 5.2 | 5.05 | 7 | 40.72 | -5.1 | 9.8 | -5.4 | 1.04 | 9.5 | 18.53 | ||||
| 30-Nov-94 | -3 | 5.31 | -4.7 | 43.57 | -3.5 | 9.3 | -1.9 | 0.98 | -1.5 | 20.29 | ||||
| 30-Dec-94 | -0.7 | 5.13 | 3.9 | 41.54 | 5.4 | 8.94 | 17.5 | 0.97 | 3.1 | 19.82 | ||||
| 31-Jan-95 | 7.1 | 5.09 | -1.9 | 43.16 | -5.6 | 9.43 | 0.8 | 1.13 | 11.5 | 20.43 | ||||
| 28-Feb-95 | 3 | 5.45 | 4.7 | 42.35 | 8 | 8.89 | -4.9 | 1.14 | 2.1 | 22.79 | ||||
| 31-Mar-95 | -0.3 | 5.58 | 9.1 | 44.18 | -1.8 | 9.55 | -12.1 | 1.08 | 2.6 | 23.23 | ||||
| 28-Apr-95 | 3.4 | 5.56 | 15.2 | 48.22 | 2.7 | 9.38 | 10.8 | 0.96 | 2.6 | 23.84 | ||||
| 31-May-95 | 11.5 | 5.75 | -1.5 | 55.28 | 2.7 | 9.69 | 9.7 | 1.06 | 8.4 | 24.45 | ||||
| 30-Jun-95 | -2.4 | 6.39 | 3.2 | 54 | 9.1 | 9.96 | -2.4 | 1.16 | 3.3 | 26.27 | ||||
| 31-Jul-95 | 5.5 | 6.23 | 13.4 | 55.74 | -1.5 | 10.86 | 1.7 | 1.14 | -1.3 | 27.18 | ||||
| 31-Aug-95 | -7.2 | 6.57 | -4.8 | 63.22 | -2.5 | 10.7 | -15.4 | 1.16 | -5.3 | 26.84 | ||||
| 29-Sep-95 | -1.6 | 6.09 | -8.6 | 58.79 | 2.6 | 10.64 | -7.7 | 0.98 | 4.8 | 25.36 | ||||
| 31-Oct-95 | -3.5 | 6 | 2.9 | 53.74 | -11.9 | 10.69 | -14.6 | 0.9 | 7.2 | 26.55 | ||||
| 30-Nov-95 | 12.2 | 5.79 | -0.4 | 55.31 | 4.1 | 9.42 | 7.3 | 0.77 | 9 | 28.45 | ||||
| 29-Dec-95 | 7.1 | 6.46 | -5.4 | 54.95 | -1 | 9.74 | -3.4 | 0.83 | 1.1 | 30.97 | ||||
| 31-Jan-96 | 5.5 | 6.92 | 18.7 | 51.02 | 7.6 | 9.88 | -10.6 | 0.8 | 11.4 | 31.42 | ||||
| 29-Feb-96 | -0.5 | 7.3 | 13.2 | 61.71 | -11.7 | 10.63 | 6.6 | 0.71 | -0.4 | 34.99 | ||||
| 29-Mar-96 | 7.7 | 7.22 | -9.3 | 69.74 | 10.5 | 9.32 | 2.5 | 0.75 | -4 | 34.81 | ||||
| 30-Apr-96 | 2.2 | 7.83 | -3.1 | 63.27 | 0.9 | 11.68 | 15.7 | 0.78 | -0.3 | 33.42 | ||||
| 31-May-96 | -2.6 | 8 | -0.6 | 58.59 | 0.6 | 11.79 | -13.5 | 0.9 | 0.7 | 33.53 | ||||
| 28-Jun-96 | -5 | 7.75 | -7.3 | 58.05 | -7.5 | 11.82 | -4.8 | 0.78 | -2.9 | 33.71 | ||||
| 31-Jul-96 | -7.8 | 7.44 | 8.6 | 53.84 | 2.7 | 11 | 1.3 | 0.74 | -0.8 | 32.75 | ||||
| 30-Aug-96 | 3.7 | 6.86 | 6.7 | 58.01 | 6.3 | 11.3 | -2.5 | 0.75 | 0.2 | 32.43 | ||||
| 30-Sep-96 | 1.1 | 7.08 | 8.9 | 60.33 | 6.3 | 11.93 | -12.8 | 0.73 | 2.2 | 32.43 | ||||
| 31-Oct-96 | -0.5 | 7.16 | 3.6 | 65.67 | 0.3 | 12.75 | 10.3 | 0.63 | -6.1 | 33.13 | ||||
| 29-Nov-96 | 6.3 | 7.12 | 23.8 | 68.05 | 0.3 | 12.79 | 1.3 | 0.69 | 5.2 | 31.13 | ||||
| 31-Dec-96 | 5.9 | 7.54 | -4.9 | 84.07 | -4.7 | 12.75 | -3.9 | 0.7 | -2.9 | 32.7 | ||||
| 31-Jan-97 | 6.1 | 7.98 | 3.5 | 78.41 | 0.9 | 12.16 | 9.6 | 0.67 | 0.3 | 31.66 | ||||
| 28-Feb-97 | -2.7 | 8.47 | -8.1 | 81.19 | 2.4 | 12.27 | -3.8 | 0.74 | -4.8 | 31.75 | ||||
| 31-Mar-97 | -0.7 | 8.2 | -4.5 | 74.4 | -6.3 | 12.49 | -2.6 | 0.71 | 9.2 | 30.18 | ||||
| 30-Apr-97 | 0.5 | 8.14 | 16.9 | 71.03 | 8.3 | 11.71 | 21.3 | 0.46 | 13.2 | 32.97 | ||||
| 30-May-97 | 11.5 | 8.21 | 8 | 87.88 | 13.9 | 12.68 | 46.2 | 0.67 | -5.9 | 37.02 | ||||
| 30-Jun-97 | 8.5 | 9.11 | 4.3 | 86.43 | 1.4 | 14.4 | 3.8 | 0.98 | -3.9 | 34.77 | ||||
| 31-Jul-97 | 2.2 | 9.88 | 17.2 | 90.17 | 15.6 | 14.61 | 19.6 | 0.85 | 11.3 | 33.32 | ||||
| 29-Aug-97 | -4.3 | 10.09 | -3.9 | 105.66 | -5.6 | 16.89 | 20.3 | 1.02 | -11.8 | 37.07 | ||||
| 30-Sep-97 | 11.6 | 9.61 | 4.6 | 99.58 | 4.3 | 15.95 | 11.3 | 1.22 | 0.7 | 32.55 | ||||
| 31-Oct-97 | -8.9 | 10.72 | -7.1 | 104.12 | -18.2 | 16.63 | -16.1 | 1.44 | -5.9 | 32.77 | ||||
| 28-Nov-97 | -2.6 | 9.79 | 11.4 | 96.75 | 6.1 | 13.61 | -5.1 | 1.21 | 8.4 | 30.83 | ||||
| 31-Dec-97 | 4.8 | 9.49 | -4.5 | 107.56 | -9.2 | 14.36 | 12.8 | 1.15 | -1.5 | 33.41 | ||||
| 30-Jan-98 | -1.6 | 9.95 | -5.6 | 101.71 | 5.9 | 13.04 | 8.8 | 1.22 | -1.3 | 32.89 | ||||
| 27-Feb-98 | 11.1 | 9.79 | 6 | 96 | 2.6 | 13.81 | 12.5 | 1.33 | 16 | 32.46 | ||||
| 31-Mar-98 | 9.4 | 10.83 | -0.5 | 101.53 | 0.5 | 14.09 | 15.2 | 1.5 | 10 | 37.58 | ||||
| 30-Apr-98 | -7.6 | 11.88 | 11.6 | 100.98 | 11.3 | 14.17 | -14.6 | 1.72 | 3.1 | 41.33 | ||||
| 29-May-98 | 3.1 | 11.01 | 1.6 | 110.85 | -11.4 | 15.81 | 1 | 1.47 | 6.2 | 42.44 | ||||
| 30-Jun-98 | -10.3 | 11.3 | -2.3 | 110.79 | -6.5 | 14.14 | -4.3 | 1.48 | 5.1 | 45.11 | ||||
Exhibit 2e
| Exhibit 2 Monthly Returns for Dow 30 Stocks | ||||||||||||||
| MERCK & CO INC | 3M | PROCTER & GAMBLE CO | PHILIP MORRIS COS INC | PRIMERICA CORP | ||||||||||
| Return (%) | Market Cap ($ bil) | Return (%) | Market Cap ($ bil) | Return (%) | Market Cap ($ bil) | Return (%) | Market Cap ($ bil) | Return (%) | Market Cap ($ bil) | |||||
| 31-Jan-90 | -6.8 | 30.64 | -1.9 | 17.84 | -8.3 | 24.35 | -9 | 38.62 | -8.1 | 2.74 | ||||
| 28-Feb-90 | -5.4 | 28.56 | 3.5 | 17.5 | -0.2 | 22.18 | -2.3 | 35.14 | 2.9 | 2.51 | ||||
| 30-Mar-90 | 2.3 | 27.03 | 1.6 | 17.95 | 6.1 | 22.14 | 8 | 34.33 | 2.3 | 2.58 | ||||
| 30-Apr-90 | 5.4 | 27.48 | -2.5 | 18.23 | 4.9 | 23.46 | 6 | 36.77 | 4.5 | 3.1 | ||||
| 31-May-90 | 13.6 | 28.96 | 5 | 17.78 | 17 | 24.45 | 0.3 | 38.97 | 13.8 | 3.24 | ||||
| 29-Jun-90 | 4.8 | 32.72 | 4.8 | 18.51 | 5.4 | 28.61 | 11.2 | 39.09 | 4.6 | 3.68 | ||||
| 31-Jul-90 | 2.7 | 34.3 | 4.3 | 19.29 | 0.1 | 30.17 | 3 | 43.18 | -5.2 | 3.78 | ||||
| 31-Aug-90 | -7.8 | 35.24 | -12.1 | 20.12 | -11.2 | 30.04 | -5.7 | 44.45 | -13.6 | 3.57 | ||||
| 28-Sep-90 | -6.7 | 32.28 | -2.1 | 17.53 | -5.4 | 26.66 | 1.2 | 41.9 | -26.5 | 3.08 | ||||
| 31-Oct-90 | 1 | 29.76 | 2.4 | 17.12 | 8.6 | 25.24 | 4.1 | 41.83 | -11.1 | 2.28 | ||||
| 30-Nov-90 | 12.2 | 30.05 | 3.8 | 17.54 | 5.4 | 27.23 | 3.2 | 43.56 | 24.8 | 2.01 | ||||
| 31-Dec-90 | 4.9 | 33.72 | 5.5 | 18.04 | 4.5 | 28.7 | 7.3 | 44.95 | 1.1 | 2.51 | ||||
| 31-Jan-91 | 1.8 | 34.82 | -1 | 18.89 | -7.9 | 30.03 | 7.5 | 47.89 | 15.7 | 2.47 | ||||
| 28-Feb-91 | 11.6 | 35.45 | 5.2 | 18.7 | 2.5 | 27.47 | 18.7 | 51.48 | 16.6 | 2.85 | ||||
| 28-Mar-91 | 3.9 | 39.56 | 0 | 19.5 | 4.8 | 28.17 | 3.7 | 61.08 | -0.8 | 3.33 | ||||
| 30-Apr-91 | 2.1 | 40.87 | 0.7 | 19.5 | -0.9 | 29.48 | -1.8 | 62.93 | -3.4 | 3.3 | ||||
| 31-May-91 | 10.3 | 41.74 | 7.7 | 19.63 | 1.5 | 29.04 | 2.4 | 61.77 | 7.7 | 3.18 | ||||
| 28-Jun-91 | -1.8 | 46.05 | -1.7 | 20.98 | -9.1 | 29.48 | -6.5 | 63.28 | -12.3 | 3.42 | ||||
| 31-Jul-91 | 10.9 | 44.94 | -6.3 | 20.56 | 5 | 26.68 | 6.7 | 58.81 | 14.4 | 3.04 | ||||
| 30-Aug-91 | -1 | 49.83 | -0.1 | 19.27 | 3.4 | 27.84 | 9.4 | 62.75 | 6.3 | 3.46 | ||||
| 30-Sep-91 | 2.6 | 49.1 | 3.7 | 19.08 | 1.6 | 28.79 | -2 | 68.66 | 5.6 | 3.68 | ||||
| 31-Oct-91 | 5.5 | 50.3 | 1 | 19.82 | -0.9 | 28.7 | -2.8 | 66.85 | 2.8 | 3.81 | ||||
| 29-Nov-91 | 6.6 | 53.06 | -3.8 | 20.01 | -3.1 | 28.27 | -3.4 | 64.99 | -10.3 | 3.91 | ||||
| 31-Dec-91 | 14.2 | 56.59 | 9.8 | 19.08 | 15.9 | 27.39 | 19.2 | 62.79 | 20.7 | 3.51 | ||||
| 31-Jan-92 | -5.6 | 64.35 | -4.5 | 20.89 | 11.1 | 31.76 | -4.8 | 74.02 | 5.7 | 4.26 | ||||
| 28-Feb-92 | 0.3 | 60.73 | 0.9 | 19.96 | -2 | 35.1 | 0.5 | 70.44 | 0 | 4.49 | ||||
| 31-Mar-92 | -6.2 | 60.92 | -2.5 | 19.96 | 0.6 | 34.39 | -0.6 | 70.79 | -3 | 4.49 | ||||
| 30-Apr-92 | -1.4 | 56.86 | 5.6 | 19.46 | 1.5 | 34.65 | 2.8 | 69.87 | 1.4 | 4.35 | ||||
| 29-May-92 | 4.2 | 56.04 | 2.9 | 20.56 | -0.5 | 34.98 | -0.5 | 71.83 | -5.5 | 4.4 | ||||
| 30-Jun-92 | -2.8 | 58.41 | 1.4 | 20.97 | -10.5 | 31.17 | -4.5 | 71.48 | 0 | 4.15 | ||||
| 31-Jul-92 | 6.4 | 56.36 | 3.1 | 21.26 | 10.7 | 31.21 | 8.7 | 67.18 | 15.2 | 4.24 | ||||
| 31-Aug-92 | -5.8 | 59.98 | -0.7 | 21.91 | -7.4 | 34.35 | 2.7 | 73.01 | -9.7 | 4.86 | ||||
| 30-Sep-92 | -8.5 | 56.22 | 4.1 | 21.59 | 5.3 | 31.8 | 4.1 | 74.95 | 10.1 | 4.39 | ||||
| 30-Oct-92 | -1.4 | 51.33 | 0.4 | 22.44 | 7.6 | 33.52 | -10.3 | 76.15 | -2.3 | 4.81 | ||||
| 30-Nov-92 | 2.8 | 50.61 | -0.1 | 22.53 | 2.6 | 35.9 | 4.8 | 68.28 | 12.2 | 4.7 | ||||
| 31-Dec-92 | -3.3 | 52.05 | -1.3 | 22.34 | -1.2 | 36.83 | -2.3 | 71.54 | 1.3 | 5.24 | ||||
| 29-Jan-93 | -6.9 | 49.75 | -2.6 | 22.05 | -6.7 | 36.45 | -3.1 | 69.29 | 9.8 | 5.31 | ||||
| 26-Feb-93 | -4.6 | 46.31 | 8.5 | 21.47 | 4.5 | 33.81 | -10.2 | 67.16 | 3.7 | 5.83 | ||||
| 31-Mar-93 | -7.5 | 44.16 | 3.8 | 23.12 | -4.1 | 35.34 | -3.7 | 60.31 | 26.1 | 7.6 | ||||
| 30-Apr-93 | 4.6 | 40.58 | 1.6 | 23.99 | -1 | 33.96 | -26.6 | 57.36 | -0.3 | 7.65 | ||||
| 28-May-93 | 3.4 | 42.44 | 2.2 | 24.38 | 0 | 33.45 | 7.2 | 42.13 | 1.2 | 7.63 | ||||
| 30-Jun-93 | -6.5 | 43.87 | -4.3 | 24.73 | 5.9 | 33.45 | -2.4 | 45.15 | 13.5 | 7.69 | ||||
| 30-Jul-93 | -13.7 | 40.65 | -2.8 | 23.63 | -5.7 | 35.43 | -2.8 | 43.3 | 2.6 | 9.26 | ||||
| 31-Aug-93 | 4.1 | 35.07 | 5.2 | 22.97 | -0.8 | 33.21 | 3.4 | 42.07 | 9.9 | 10.41 | ||||
| 30-Sep-93 | -2.7 | 36.5 | -6.2 | 23.98 | -1.8 | 32.96 | -4.6 | 43.52 | 7.6 | 10.41 | ||||
| 29-Oct-93 | 4.5 | 34.92 | 0.9 | 22.32 | 14.9 | 32.38 | 17.2 | 40.2 | -7.6 | 11.2 | ||||
| 30-Nov-93 | 6.6 | 36.48 | 5.9 | 22.51 | 4.6 | 36.99 | 4.2 | 47.1 | -9.1 | 10.35 | ||||
| 31-Dec-93 | 1.2 | 42.73 | -0.2 | 23.52 | 0.4 | 38.73 | 0.5 | 49.09 | -2.8 | 9.38 | ||||
| 31-Jan-94 | 6.2 | 44.08 | -1.4 | 23.47 | 4.9 | 38.9 | 8.3 | 48.77 | 8.4 | 9.41 | ||||
| 28-Feb-94 | -11.3 | 46.8 | -0.9 | 23.14 | -3.4 | 40.61 | -7.1 | 52.83 | -11.6 | 13.51 | ||||
| 31-Mar-94 | -7.2 | 41.51 | -6.1 | 22.74 | -7 | 39.29 | -8.4 | 49.1 | -5.1 | 11.9 | ||||
| 29-Apr-94 | -0.4 | 38.15 | -1 | 21.19 | 6.9 | 36.56 | 7.7 | 44.39 | -1.4 | 11.3 | ||||
| 31-May-94 | 3 | 37.99 | 5 | 20.97 | -0.9 | 38.86 | -9.6 | 47.79 | -5 | 11.14 | ||||
| 30-Jun-94 | -1.5 | 38.25 | -2.7 | 21.6 | -5.3 | 38.52 | 6 | 43.2 | -1.9 | 10.64 | ||||
| 29-Jul-94 | -0.4 | 37.4 | 7.1 | 21.02 | 5.1 | 36.5 | 6.8 | 45.17 | 2.7 | 10.44 | ||||
| 31-Aug-94 | 15.2 | 37.24 | 4.6 | 22.5 | 9.2 | 38.13 | 10.9 | 48.24 | 12.2 | 10.78 | ||||
| 30-Sep-94 | 5.3 | 42.89 | 0.2 | 23.35 | -2.1 | 41.63 | 1.6 | 53.15 | -11.1 | 12.04 | ||||
| 31-Oct-94 | 0 | 44.9 | 0.2 | 23.34 | 6 | 40.78 | 0.2 | 52.94 | 5.7 | 10.66 | ||||
| 30-Nov-94 | 4.6 | 44.9 | -6.7 | 23.4 | -0.6 | 43 | -2.4 | 53.04 | -5.3 | 11.27 | ||||
| 30-Dec-94 | 3.2 | 46.87 | 4.1 | 21.55 | -0.8 | 42.81 | -2.4 | 51.74 | -1.1 | 10.62 | ||||
| 31-Jan-95 | 5.6 | 47.98 | -1.9 | 22.44 | 5.6 | 42.49 | 3.9 | 49.42 | 14.5 | 10.37 | ||||
| 28-Feb-95 | 5.3 | 50.65 | 5.4 | 22.02 | 2.1 | 44.63 | 1.7 | 51.35 | 5.4 | 11.82 | ||||
| 31-Mar-95 | 1.3 | 53.32 | 6.2 | 23.02 | -0.4 | 45.58 | 9 | 52.21 | -0.6 | 12.46 | ||||
| 28-Apr-95 | 0.6 | 52.87 | 2.6 | 24.4 | 6 | 45.41 | 3.6 | 55.7 | 7.1 | 12.38 | ||||
| 31-May-95 | 9.6 | 53.18 | 1.4 | 25.03 | 2.9 | 47.89 | 7.6 | 57.72 | 2.3 | 13.1 | ||||
| 30-Jun-95 | 5.2 | 58.12 | -4.4 | 25.2 | 0 | 49.4 | 3.2 | 61.57 | 3.9 | 13.47 | ||||
| 31-Jul-95 | 5.1 | 60.75 | -1.3 | 24.09 | -3.6 | 49.4 | -3.7 | 62.83 | 8.3 | 13.99 | ||||
| 31-Aug-95 | -3.4 | 63.84 | -2.7 | 23.78 | 0.7 | 47.34 | 4.2 | 60.51 | 1.7 | 15.15 | ||||
| 29-Sep-95 | 13 | 61.68 | 3.2 | 22.95 | 11 | 47.69 | 13.2 | 62.69 | 10.7 | 15.35 | ||||
| 31-Oct-95 | 2.7 | 69.19 | 0.9 | 23.69 | 5.7 | 52.87 | 0.9 | 70.14 | -4.6 | 16.95 | ||||
| 30-Nov-95 | 7.6 | 71.04 | 15.8 | 23.9 | 6.8 | 55.61 | 4.2 | 70.77 | 18.2 | 16.11 | ||||
| 29-Dec-95 | 6.6 | 76.45 | 1.5 | 27.43 | -4 | 59.37 | 4 | 73.71 | 5.3 | 18.99 | ||||
| 31-Jan-96 | 6.9 | 80.81 | -2.8 | 27.85 | 1.7 | 56.96 | 2.8 | 75.33 | 5 | 19.81 | ||||
| 29-Feb-96 | -5.5 | 86.35 | 1.7 | 27.07 | -2.4 | 57.65 | 6.7 | 77.42 | 2.1 | 20.8 | ||||
| 29-Mar-96 | -5.5 | 81.57 | -0.8 | 27.33 | 3.4 | 56.29 | -10.4 | 82.64 | -1.3 | 21.16 | ||||
| 30-Apr-96 | -2.8 | 76.65 | 1.7 | 27.03 | 0.2 | 58.17 | 2.7 | 73.25 | -6.8 | 20.88 | ||||
| 31-May-96 | 6.8 | 74.27 | 4.5 | 27.5 | 4 | 58 | 10.3 | 74.78 | 1.5 | 19.45 | ||||
| 28-Jun-96 | 0.5 | 79.33 | 1.1 | 28.55 | 3.1 | 60.32 | 5.7 | 82.46 | 9.9 | 19.69 | ||||
| 31-Jul-96 | -0.6 | 78.62 | -2.3 | 28.86 | -1 | 62.16 | 0.6 | 86.29 | -7.4 | 21.64 | ||||
| 30-Aug-96 | 2.1 | 78.16 | 6.5 | 27.21 | -0.4 | 61.22 | -14.2 | 86.81 | 3 | 20.04 | ||||
| 30-Sep-96 | 7.8 | 79.84 | 1.5 | 28.82 | 9.7 | 60.96 | 1.3 | 74.47 | 13.3 | 20.58 | ||||
| 31-Oct-96 | 5 | 85.61 | 9.5 | 29.24 | 2 | 66.84 | 2.9 | 73.48 | 10.7 | 23.6 | ||||
| 29-Nov-96 | 12.4 | 89.05 | 10.3 | 32.01 | 9.8 | 67.79 | 11.8 | 75.63 | 10.6 | 26.06 | ||||
| 31-Dec-96 | -3.6 | 100.05 | -0.9 | 35.01 | -1 | 74.46 | 10.6 | 84.53 | 0.8 | 28.83 | ||||
| 31-Jan-97 | 13.8 | 95.98 | 2.7 | 34.69 | 7.5 | 73.4 | 5.2 | 92.03 | 15.8 | 28.99 | ||||
| 28-Feb-97 | 1.7 | 109.24 | 8.5 | 35.63 | 3.9 | 78.85 | 13.8 | 96.81 | 2.4 | 33.46 | ||||
| 31-Mar-97 | -8.1 | 111.05 | -8 | 38.46 | -4.5 | 81.92 | -14.7 | 110.15 | -10.5 | 34.26 | ||||
| 30-Apr-97 | 7.3 | 101.94 | 2.8 | 35.27 | 10 | 77.97 | 3.5 | 92.4 | 15.6 | 30.67 | ||||
| 30-May-97 | -0.6 | 109.35 | 6.2 | 36.26 | 9.6 | 85.44 | 11.7 | 95.63 | -0.6 | 35.6 | ||||
| 30-Jun-97 | 14.3 | 108.49 | 11.3 | 38.24 | 2.4 | 93.39 | 1.5 | 106.87 | 14.7 | 35.27 | ||||
| 31-Jul-97 | 1.5 | 123.5 | -7.3 | 42.56 | 8.1 | 95.68 | 2 | 107.19 | 14.3 | 40.44 | ||||
| 29-Aug-97 | -11.6 | 125.39 | -4.6 | 39.44 | -12.5 | 103.04 | -3.2 | 109.3 | -11.7 | 46.13 | ||||
| 30-Sep-97 | 9.3 | 110.9 | 2.9 | 37.34 | 3.8 | 90.17 | -3.9 | 105.82 | 7.6 | 40.71 | ||||
| 31-Oct-97 | -10.7 | 120.71 | -1 | 38.41 | -1.2 | 93.56 | -4.7 | 100.71 | 2.6 | 43.8 | ||||
| 28-Nov-97 | 6.2 | 107.8 | 7.1 | 37.39 | 12 | 92.12 | 9.8 | 96.01 | 9 | 48.93 | ||||
| 31-Dec-97 | 12.3 | 113.61 | -15.8 | 39.82 | 4.8 | 103.21 | 4.9 | 105.4 | 5.9 | 58.21 | ||||
| 30-Jan-98 | 10.7 | 127.02 | 1.8 | 33.54 | -1.5 | 107.27 | -8.3 | 109.64 | -8 | 61.64 | ||||
| 27-Feb-98 | 8.7 | 140.65 | 2.8 | 34.12 | 8.3 | 105.34 | 4.8 | 100.61 | 12.5 | 56.7 | ||||
| 31-Mar-98 | 0.8 | 152.85 | 6.7 | 34.86 | -0.6 | 113.93 | -3.2 | 105.46 | 7.9 | 63.64 | ||||
| 30-Apr-98 | -6 | 153.31 | 3.7 | 36.77 | -2.3 | 113.26 | -10.9 | 101.22 | 2.2 | 69.1 | ||||
| 29-May-98 | -2.9 | 144.12 | -1.3 | 38.13 | 2.1 | 110.33 | 0.7 | 90.14 | 0.1 | 70.47 | ||||
| 30-Jun-98 | 14.7 | 139.85 | -11.3 | 37.47 | 8.6 | 112.59 | 6.4 | 90.8 | -1 | 70.44 | ||||
Exhibit 2f
| Exhibit 2 Monthly Returns for Dow 30 Stocks | ||||||||||||||||||||
| SEARS ROEBUCK & CO | TEXACO INC. | UNION CARBIDE | UNITED TECHNOLOGIES | WESTINGHOUSE | WOOLWORTH CORP | USX CORP | ||||||||||||||
| Return (%) | Market Cap ($ bil) | Return (%) | Market Cap ($ bil) | Return (%) | Market Cap ($ bil) | Return (%) | Market Cap ($ bil) | Return (%) | Market Cap ($ bil) | Return (%) | Market Cap ($ bil) | Return (%) | Market Cap ($ bil) | |||||||
| 31-Jan-90 | 4.6 | 13.05 | -1.1 | 15.63 | -4.8 | 3.27 | -8.1 | 6.91 | -2.4 | 10.75 | -8.9 | 4.11 | -6.3 | 9.15 | ||||||
| 28-Feb-90 | 4.1 | 13.65 | 2.4 | 15.47 | 10.7 | 3.11 | 3.4 | 6.35 | -1.2 | 10.5 | 3.2 | 3.72 | 7.8 | 8.57 | ||||||
| 30-Mar-90 | -4.3 | 14.04 | -0.2 | 15.63 | -10.3 | 3.41 | 12 | 6.51 | 6.7 | 10.28 | 5.9 | 3.84 | -0.4 | 9.15 | ||||||
| 30-Apr-90 | -9.6 | 13.44 | -1.9 | 15.6 | -10.9 | 3.08 | -3.9 | 7.29 | -3.9 | 10.97 | -3.7 | 4.07 | -7.1 | 9.11 | ||||||
| 31-May-90 | 3.5 | 12.16 | 3.9 | 15.3 | 4.5 | 2.74 | 7.4 | 7.01 | 1.2 | 10.44 | 10.8 | 3.88 | 2.7 | 8.37 | ||||||
| 29-Jun-90 | 0.7 | 12.41 | -4.2 | 15.7 | -3.8 | 2.83 | -2.3 | 7.47 | 1 | 10.57 | -1.5 | 4.24 | -1.9 | 8.59 | ||||||
| 31-Jul-90 | -7.9 | 12.52 | 11.7 | 15 | 0.6 | 2.74 | 3.5 | 6.93 | -2.8 | 10.72 | -7.2 | 4.25 | 4.5 | 8.41 | ||||||
| 31-Aug-90 | -11.5 | 11.53 | -1.2 | 16.76 | -12.3 | 2.76 | -16.8 | 7.17 | -7.4 | 10.32 | -15.3 | 3.91 | -5.9 | 8.79 | ||||||
| 28-Sep-90 | -13.2 | 10.03 | -0.8 | 16.36 | -10.4 | 2.38 | -12.5 | 5.92 | -9.2 | 9.55 | -7.3 | 3.31 | -6.2 | 8.18 | ||||||
| 31-Oct-90 | -3 | 8.7 | -3.3 | 15.81 | 9.2 | 2.15 | 5.6 | 5.17 | -15.1 | 8.66 | 7.9 | 3.07 | 4.1 | 7.68 | ||||||
| 30-Nov-90 | 8.1 | 8.45 | 1.8 | 15.29 | -0.8 | 2.35 | -0.1 | 5.46 | 6.8 | 7.35 | 15.3 | 3.28 | 0.7 | 8 | ||||||
| 31-Dec-90 | -2.9 | 8.96 | 1.7 | 15.36 | 2.3 | 2.29 | 7.3 | 5.4 | 7 | 7.75 | 3.4 | 3.78 | -2.4 | 7.97 | ||||||
| 31-Jan-91 | 13.3 | 8.71 | -2.6 | 15.62 | 16 | 2.04 | -0.8 | 5.81 | 0 | 8.31 | 5 | 3.92 | 2.5 | 7.78 | ||||||
| 28-Feb-91 | 10 | 9.86 | 9.2 | 15 | 0.7 | 2.37 | 5.7 | 5.76 | -5.8 | 8.31 | 4 | 4.08 | -0.1 | 7.97 | ||||||
| 28-Mar-91 | 12.5 | 10.68 | 0.6 | 16.39 | -6.6 | 2.35 | -2.5 | 6.03 | 12.3 | 7.72 | 2.3 | 4.24 | 0.4 | 7.88 | ||||||
| 30-Apr-91 | 6.8 | 12.01 | 5.9 | 16.49 | 2.8 | 2.22 | -5.2 | 5.88 | -6.4 | 8.67 | -7.8 | 4.34 | 2.3 | 7.89 | ||||||
| 31-May-91 | 10 | 12.82 | -3.4 | 17.46 | 11.7 | 2.28 | 2.9 | 5.57 | 8.2 | 8.02 | 9 | 3.97 | -4.9 | 7.99 | ||||||
| 28-Jun-91 | -6.8 | 13.94 | -6.8 | 16.65 | 1.9 | 2.51 | -5.1 | 5.68 | -6.3 | 8.67 | -7.9 | 4.33 | -12.2 | 6.52 | ||||||
| 31-Jul-91 | 8.3 | 13.02 | 9.4 | 15.52 | 0 | 2.56 | 4.8 | 5.35 | -6.3 | 8.74 | -5.2 | 3.99 | 12.8 | 5.73 | ||||||
| 30-Aug-91 | 2.4 | 14.09 | -1.3 | 16.98 | 6.7 | 2.56 | 3.6 | 5.61 | -6.8 | 8.19 | 6.1 | 3.74 | 29.1 | 6.46 | ||||||
| 30-Sep-91 | -7.2 | 14.26 | -1.9 | 16.56 | -5.8 | 2.7 | -6 | 5.76 | -7.3 | 7.53 | -5.7 | 3.97 | -5.7 | 8.33 | ||||||
| 31-Oct-91 | -2.6 | 13.24 | 3.6 | 16.24 | -3.7 | 2.56 | 8.1 | 5.47 | -20.8 | 6.99 | 0.1 | 3.75 | -3.2 | 7.91 | ||||||
| 29-Nov-91 | -4.3 | 12.9 | -9.3 | 16.82 | -9 | 2.47 | -1.1 | 5.91 | -8.7 | 5.54 | -11.4 | 3.72 | -8.5 | 7.66 | ||||||
| 31-Dec-91 | 7.1 | 12.17 | 5.2 | 15.05 | 15.7 | 2.21 | 13.9 | 5.79 | 14.3 | 4.95 | 4.4 | 3.29 | -9.3 | 6.92 | ||||||
| 31-Jan-92 | 8.3 | 13.03 | -0.9 | 15.83 | 14.2 | 2.57 | -6.5 | 6.6 | 2.8 | 6.13 | 12.3 | 3.45 | -6.1 | 6.27 | ||||||
| 28-Feb-92 | 7 | 14.11 | -1.7 | 15.48 | 7.6 | 2.93 | 0.3 | 6.13 | 9.1 | 6.3 | -2.5 | 3.84 | 1 | 5.88 | ||||||
| 31-Mar-92 | 3.5 | 14.92 | -2.3 | 15.22 | 1.5 | 3.12 | 3.2 | 6.13 | -6.9 | 6.81 | 7.4 | 3.75 | -12.6 | 5.85 | ||||||
| 30-Apr-92 | -2.8 | 15.44 | 9.7 | 14.86 | 11 | 3.17 | 3.8 | 6.34 | -2.7 | 6.32 | -7.6 | 4.02 | 15 | 5.56 | ||||||
| 29-May-92 | 1.1 | 15.01 | 2.8 | 16.09 | 4.5 | 3.52 | -1.9 | 6.58 | -5.2 | 6.15 | -2.7 | 3.68 | 4.2 | 6.39 | ||||||
| 30-Jun-92 | -8.9 | 15.01 | -3.5 | 16.54 | -5.7 | 3.65 | -0.5 | 6.4 | 3.7 | 5.77 | -1.4 | 3.58 | -7.9 | 6.57 | ||||||
| 31-Jul-92 | 0.6 | 13.71 | 4.9 | 15.96 | 29.6 | 3.46 | 9.1 | 6.37 | -2.8 | 6.02 | 7 | 3.54 | -1.1 | 6.19 | ||||||
| 31-Aug-92 | 5 | 13.8 | 2.7 | 16.55 | -9.6 | 1.91 | -2.7 | 6.95 | -3.3 | 5.85 | 5.2 | 3.75 | -9.4 | 6.12 | ||||||
| 30-Sep-92 | 7.8 | 14.31 | -2.5 | 17 | -1.9 | 1.71 | -10.9 | 6.7 | -0.8 | 5.59 | 7 | 3.94 | -2 | 5.44 | ||||||
| 30-Oct-92 | -6.1 | 15.44 | -5.2 | 16.59 | 11.4 | 1.68 | -6.6 | 6.03 | -20.8 | 5.55 | 1.6 | 4.22 | -8.7 | 5.34 | ||||||
| 30-Nov-92 | 4.2 | 14.49 | 0.2 | 15.52 | 11.5 | 1.88 | -0.9 | 5.63 | -0.5 | 4.4 | 5 | 4.26 | -2.7 | 4.87 | ||||||
| 31-Dec-92 | 5.2 | 14.92 | -0.6 | 15.56 | 3.1 | 2.07 | 7.2 | 5.52 | 5.9 | 4.31 | -7.7 | 4.47 | 4.5 | 4.7 | ||||||
| 29-Jan-93 | 8 | 15.71 | 1 | 15.46 | 2.3 | 2.19 | -2.6 | 5.95 | 2.8 | 4.6 | -6.2 | 4.15 | -1.4 | 4.94 | ||||||
| 26-Feb-93 | 8.4 | 16.96 | 5.1 | 15.62 | -0.4 | 2.24 | -3.6 | 5.8 | -2 | 4.73 | -1.3 | 3.85 | 12 | 4.87 | ||||||
| 31-Mar-93 | 3.5 | 18.26 | 1.2 | 16.2 | 7.5 | 2.2 | 5.6 | 5.54 | 10.3 | 4.6 | 9.5 | 3.8 | 3.3 | 5.4 | ||||||
| 30-Apr-93 | -4.3 | 18.9 | -0.2 | 16.4 | 8.3 | 2.37 | 4.2 | 5.84 | 2.5 | 5.08 | -3.4 | 4.16 | -5.1 | 5.58 | ||||||
| 28-May-93 | 4.6 | 18.08 | 2.3 | 16.36 | -2.2 | 2.57 | 8.3 | 6.09 | 1.5 | 5.21 | -3.3 | 3.98 | 2.3 | 5.3 | ||||||
| 30-Jun-93 | 1.1 | 18.78 | -1 | 16.53 | 2 | 2.48 | 2.1 | 6.54 | 4.1 | 5.25 | -7.7 | 3.85 | -10 | 5.37 | ||||||
| 30-Jul-93 | 22 | 19.18 | -0.6 | 16.37 | -2.6 | 2.91 | 0.5 | 6.7 | -0.8 | 5.53 | -7.2 | 3.56 | 4.4 | 4.84 | ||||||
| 31-Aug-93 | 9.5 | 17.48 | 4.5 | 16.27 | -0.3 | 2.84 | 5.7 | 6.73 | -1.7 | 5.49 | 3.5 | 3.27 | 15.9 | 5.05 | ||||||
| 30-Sep-93 | -1.1 | 19.01 | 4.4 | 16.79 | 4.7 | 2.8 | -2.4 | 7.05 | -15.4 | 5.36 | -2.9 | 3.38 | -1.2 | 5.8 | ||||||
| 29-Oct-93 | 6.5 | 18.85 | 0.6 | 17.53 | 1.9 | 2.94 | 11.7 | 6.88 | 11.5 | 4.55 | -8.3 | 3.3 | -7.5 | 5.73 | ||||||
| 30-Nov-93 | -4.5 | 20.08 | -4.7 | 17.63 | 6.6 | 2.99 | 0.5 | 7.69 | -2.8 | 5.08 | 2.2 | 2.98 | -7.9 | 5.3 | ||||||
| 31-Dec-93 | -2.8 | 19.03 | 1 | 16.6 | 7.2 | 3.16 | 0.2 | 7.69 | 0.9 | 4.9 | 9.7 | 3.05 | -2.2 | 4.84 | ||||||
| 31-Jan-94 | 3.8 | 18.54 | 4.4 | 16.77 | 14 | 3.4 | 8.7 | 7.75 | -0.5 | 4.96 | 3.1 | 3.35 | 13.2 | 4.73 | ||||||
| 28-Feb-94 | -16.1 | 19.24 | -2.9 | 17.51 | -5.6 | 3.87 | 1.6 | 8.42 | 2.7 | 4.95 | -15 | 3.41 | -6.8 | 5.3 | ||||||
| 31-Mar-94 | -5.5 | 16 | -2.9 | 16.8 | -5.8 | 3.62 | -8.6 | 8.5 | -16.5 | 5.08 | -31.3 | 2.9 | -4.3 | 4.94 | ||||||
| 29-Apr-94 | 9 | 15.12 | 1 | 16.32 | 17.2 | 3.42 | 2.6 | 7.76 | -3.1 | 4.24 | 11.8 | 2 | 2.3 | 4.73 | ||||||
| 31-May-94 | 8.6 | 16.49 | 1.1 | 16.48 | 2.6 | 4 | 4.8 | 7.97 | 12.3 | 4.11 | -5.3 | 2.19 | 2.5 | 4.84 | ||||||
| 30-Jun-94 | -5.2 | 17.78 | -4.9 | 16.45 | -1.4 | 4.06 | -3.2 | 8.4 | -10.6 | 4.59 | 0.8 | 2.08 | -2.2 | 4.91 | ||||||
| 29-Jul-94 | -1.6 | 16.86 | 5.2 | 15.65 | 6.6 | 4.01 | -6.2 | 8.16 | 4.3 | 4.11 | -3.8 | 2.09 | 3.7 | 4.8 | ||||||
| 31-Aug-94 | 1.1 | 16.6 | -1.3 | 16.46 | 22.3 | 4.27 | 6.4 | 7.65 | 16.9 | 4.29 | 7.4 | 2 | 0.3 | 4.98 | ||||||
| 30-Sep-94 | 1.3 | 16.64 | -3 | 16.04 | -1.1 | 5.2 | -1.6 | 8.08 | -8 | 4.99 | 6.9 | 2.14 | 2.9 | 4.94 | ||||||
| 31-Oct-94 | 3.1 | 16.87 | 9 | 15.56 | -2.9 | 5.14 | 0.6 | 7.91 | 9 | 4.61 | -9.9 | 2.29 | 7.3 | 5.09 | ||||||
| 30-Nov-94 | -3.7 | 17.4 | -3.7 | 16.96 | -12.7 | 4.95 | -6.3 | 7.96 | -9.7 | 5.01 | -8.9 | 2.05 | -4.6 | 5.41 | ||||||
| 30-Dec-94 | -2.6 | 16.61 | -3.6 | 16.12 | 2.6 | 4.25 | 7.5 | 7.29 | -3.9 | 4.54 | 6.2 | 1.87 | -9 | 5.16 | ||||||
| 31-Jan-95 | -3.8 | 16.18 | 2.9 | 15.54 | -13.2 | 4.37 | 2.2 | 7.84 | 14.7 | 4.36 | 6 | 1.99 | -2.3 | 4.7 | ||||||
| 28-Feb-95 | 12.2 | 15.56 | 4.7 | 15.99 | 13 | 3.79 | 4.1 | 8.01 | 10.7 | 4.98 | -3.2 | 2.09 | 2.6 | 4.59 | ||||||
| 31-Mar-95 | 8.4 | 17.32 | 4.5 | 16.54 | 7 | 4.25 | 4.1 | 8.17 | -8.9 | 5.51 | 21.3 | 2.02 | 7.7 | 4.67 | ||||||
| 28-Apr-95 | 1.6 | 20.67 | 2.6 | 17.29 | 4.9 | 4.55 | 5.8 | 8.51 | 6.2 | 5.04 | -13.5 | 2.45 | 7.1 | 5.03 | ||||||
| 31-May-95 | 4.9 | 21.02 | 1.4 | 17.75 | -8.8 | 4.77 | 4.4 | 9.01 | -3 | 5.36 | -3.9 | 2.12 | 6.9 | 5.38 | ||||||
| 30-Jun-95 | 5.3 | 21.89 | -4.2 | 17.78 | 15 | 4.33 | 3 | 9.36 | 0.9 | 5.19 | -1.6 | 2.04 | -0.6 | 5.71 | ||||||
| 31-Jul-95 | 6.3 | 23.11 | 1.1 | 17.04 | 3.7 | 4.6 | 7.5 | 9.64 | -6.8 | 5.24 | 3.3 | 2 | 1.9 | 5.67 | ||||||
| 31-Aug-95 | -0.1 | 12.67 | -1.2 | 17.24 | 2.7 | 4.77 | -0.1 | 10.36 | 0.4 | 4.88 | -14.4 | 2.07 | 3.3 | 5.98 | ||||||
| 29-Sep-95 | 13.9 | 12.61 | -0.4 | 16.82 | 12 | 4.87 | 6 | 10.27 | 10.1 | 4.89 | 17.8 | 1.77 | -4.2 | 6.13 | ||||||
| 31-Oct-95 | -7.8 | 14.36 | 5.6 | 16.75 | -4.7 | 5.46 | 0.4 | 10.89 | -5.8 | 5.39 | -7.1 | 2.09 | -10.1 | 5.67 | ||||||
| 30-Nov-95 | 16.5 | 13.24 | 9.6 | 17.71 | 5.1 | 5.2 | 6.3 | 10.94 | 19.8 | 5.07 | 2.6 | 1.95 | 4.5 | 5.1 | ||||||
| 29-Dec-95 | -1 | 15.35 | 6.3 | 19.21 | -5.4 | 5.44 | 1.2 | 11.55 | -3 | 6.62 | -13.3 | 2 | 6.1 | 5.28 | ||||||
| 31-Jan-96 | 6.4 | 15.2 | 3 | 20.73 | 12.3 | 5.15 | 8.2 | 11.58 | 26.7 | 6.8 | -13.5 | 1.73 | -3.8 | 5.6 | ||||||
| 29-Feb-96 | 9.9 | 16.18 | -0.4 | 21.36 | 7.3 | 5.78 | 5.2 | 12.52 | -10.6 | 8.62 | 6.7 | 1.5 | -0.4 | 5.39 | ||||||
| 29-Mar-96 | 7.4 | 17.69 | 7.5 | 21.06 | 10.3 | 6.18 | 4.5 | 13.1 | 4.7 | 7.68 | 30.2 | 1.6 | 4.1 | 5.32 | ||||||
| 30-Apr-96 | 2.6 | 19.11 | -0.3 | 22.65 | -8.3 | 6.7 | -1.6 | 13.7 | -2.6 | 8.08 | 22.4 | 2.08 | 14.3 | 5.53 | ||||||
| 31-May-96 | 2.2 | 19.57 | -1.1 | 22.58 | -4.8 | 6.15 | -0.5 | 13.45 | -2.4 | 7.87 | 7.2 | 2.54 | 0.2 | 6.32 | ||||||
| 28-Jun-96 | -4.4 | 19.91 | 0.1 | 22.12 | -7.8 | 5.74 | 5.1 | 13.31 | 2.7 | 7.67 | 9.8 | 2.73 | -8 | 6.29 | ||||||
| 31-Jul-96 | -15.7 | 19.07 | 1.3 | 22.16 | 5.7 | 5.29 | -2.2 | 14 | -11.3 | 7.91 | -14.4 | 2.99 | 1.9 | 5.78 | ||||||
| 30-Aug-96 | 7.9 | 16.08 | 5.4 | 22.46 | 3.4 | 5.49 | 0.7 | 13.7 | -1.9 | 7.02 | 10.4 | 2.56 | 2.7 | 5.89 | ||||||
| 30-Sep-96 | 1.7 | 17.22 | 3.7 | 23.45 | 5.5 | 5.65 | 6.8 | 13.73 | 13.7 | 6.86 | -2.9 | 2.83 | 3.6 | 6 | ||||||
| 31-Oct-96 | 8.1 | 17.52 | 10.5 | 24.31 | -6.6 | 5.96 | 7 | 14.66 | -7.8 | 7.84 | 1.8 | 2.75 | 1.2 | 6.22 | ||||||
| 29-Nov-96 | 3.3 | 18.94 | -1.6 | 26.86 | 8.7 | 5.53 | 9.4 | 15.56 | 9.5 | 7.21 | 14.3 | 2.8 | 5.4 | 6.29 | ||||||
| 31-Dec-96 | -7.5 | 19.47 | -1 | 26.2 | -11.4 | 5.87 | -5.5 | 16.01 | 6 | 7.89 | -8.3 | 3.2 | 4.4 | 6.58 | ||||||
| 31-Jan-97 | 4.3 | 18.01 | 7.9 | 25.95 | 11 | 5.21 | 5.3 | 15.93 | -7.5 | 8.38 | -7.4 | 2.95 | 11.5 | 6.86 | ||||||
| 28-Feb-97 | 13.5 | 18.79 | -5.8 | 28 | 4.5 | 5.78 | 8.3 | 16.77 | -5.9 | 11.52 | 2.5 | 2.73 | 0.7 | 7.65 | ||||||
| 31-Mar-97 | -7.6 | 21.24 | 10.7 | 26.15 | -6.3 | 6.02 | 0.7 | 17.86 | 3.6 | 10.42 | 12 | 2.8 | 4.7 | 7.65 | ||||||
| 30-Apr-97 | -4.2 | 19.62 | -3.7 | 28.96 | 12.7 | 5.63 | -0.2 | 17.98 | -5.6 | 10.8 | -8 | 3.13 | -0.9 | 8.01 | ||||||
| 30-May-97 | 2.8 | 18.82 | 4.2 | 27.82 | -5.9 | 6.32 | 6.7 | 17.95 | 20.3 | 10.19 | 12.2 | 2.88 | 8.8 | 7.95 | ||||||
| 30-Jun-97 | 9.4 | 19.26 | -0.3 | 28.77 | 0.7 | 5.87 | 3.3 | 19.04 | 14.2 | 12.36 | -0.5 | 3.24 | -3.3 | 8.59 | ||||||
| 31-Jul-97 | 17.4 | 21.07 | 6.7 | 28.67 | 17.7 | 5.91 | 1.9 | 19.66 | 4.1 | 14.7 | 18 | 3.22 | 11.5 | 8.31 | ||||||
| 29-Aug-97 | -9.7 | 24.72 | 0.2 | 30.6 | -7 | 6.95 | -7.3 | 19.91 | 7 | 15.29 | -21 | 3.8 | 1.8 | 9.26 | ||||||
| 30-Sep-97 | 0.3 | 22.22 | 6.5 | 30.47 | -5.1 | 6.44 | 3.8 | 18.38 | 5.4 | 16.61 | -1.1 | 3 | 14.2 | 9.37 | ||||||
| 31-Oct-97 | -26.5 | 22.3 | -7.1 | 32.45 | -6.2 | 6.11 | -13.6 | 19.07 | -2.3 | 17.5 | -14.1 | 2.98 | -3.9 | 10.7 | ||||||
| 28-Nov-97 | 10 | 16.4 | -0.2 | 30.14 | -2.9 | 5.73 | 7.5 | 16.31 | 13.7 | 18.66 | 13.8 | 2.56 | -3.7 | 10.29 | ||||||
| 31-Dec-97 | -1.2 | 17.96 | -3.8 | 30.92 | -2.7 | 6.09 | -2.8 | 17.46 | -1.9 | 21.34 | -5.8 | 2.92 | -1.5 | 9.86 | ||||||
| 30-Jan-98 | 1.7 | 17.74 | -4 | 29.76 | 2 | 5.92 | 11.6 | 16.96 | 1.7 | 20.94 | 6.7 | 2.75 | -0.6 | 9.73 | ||||||
| 27-Feb-98 | 15.7 | 18.03 | 7.7 | 28.56 | 6.5 | 6.04 | 10.3 | 18.93 | 3.5 | 21.29 | 9.2 | 2.93 | 3.6 | 9.68 | ||||||
| 31-Mar-98 | 8.4 | 20.78 | 8.1 | 30.51 | 7.9 | 6.4 | 3.4 | 20.81 | 9.7 | 22 | 5.3 | 3.2 | 8.9 | 9.97 | ||||||
| 30-Apr-98 | 3.3 | 22.45 | 2.3 | 32.59 | -3.2 | 6.87 | 6.6 | 21.16 | 5 | 24.25 | -8 | 3.37 | -4.8 | 10.85 | ||||||
| 29-May-98 | 4.6 | 23.18 | -5.6 | 33.33 | 3.4 | 6.64 | -4.1 | 22.59 | -10.9 | 25.46 | -14.1 | 3.11 | -1.7 | 10.33 | ||||||
| 30-Jun-98 | -1.2 | 24.16 | 3.4 | 31.25 | 6.9 | 6.8 | -1.6 | 21.57 | 0 | 22.8 | -3.2 | 2.67 | -2 | 10.09 | ||||||
Exhibit 3
| Germany | Ireland | Italy | Japan | |||||||||
| Date | Stock Return | Market Capitalization | Bond Return | Stock Return | Market Capitalization | Bond Return | Stock Return | Market Capitalization | Bond Return | Stock Return | Market Capitalization | Bond Return |
| 1981 | 3.27 | 57,569 | 4.11 | -4.26 | 1,316 | 5.11 | 4.62 | 23,528 | -3.10 | 21.90 | 358,043 | 18.49 |
| 1982 | 19.42 | 61,691 | 23.10 | -5.61 | 995 | 38.04 | -10.55 | 18,073 | 27.56 | 5.72 | 439,744 | 10.83 |
| 1983 | 40.75 | 73,880 | 7.09 | 76.75 | 1,404 | 16.71 | 22.92 | 17,915 | 36.26 | 26.49 | 509,844 | 9.47 |
| 1984 | 11.06 | 69,496 | 18.14 | -0.91 | 1,147 | 12.36 | 30.84 | 19,532 | 44.70 | 29.18 | 509,844 | 10.48 |
| 1985 | 79.47 | 155,940 | 11.69 | 66.23 | 2,286 | 34.31 | 108.42 | 45,693 | 18.67 | 14.16 | 725,436 | 10.59 |
| 1986 | 7.23 | 211,692 | 11.89 | 54.20 | 4,350 | 5.42 | 73.73 | 106,518 | 50.21 | 56.86 | 1,455,105 | 14.17 |
| 1987 | -38.47 | 162,908 | 3.10 | -11.41 | 4,963 | 28.15 | -32.59 | 85,250 | -3.98 | 8.13 | 2,137,715 | 7.84 |
| 1988 | 31.09 | 200,860 | 2.98 | 43.60 | 7,340 | 25.57 | 26.41 | 96,192 | 14.52 | 38.09 | 2,964,727 | 5.36 |
| 1989 | 37.46 | 282,378 | -2.93 | 37.16 | 9,785 | 3.15 | 15.29 | 114,032 | -1.24 | 20.47 | 3,150,654 | -3.83 |
| 1990 | -18.36 | 260,676 | -2.06 | -26.33 | 8,162 | 7.00 | -27.72 | 89,919 | 8.41 | -38.94 | 2,027,842 | -0.09 |
| 1991 | 8.13 | 266,741 | 12.39 | 17.78 | 10,337 | 14.96 | 2.22 | 103,415 | 26.60 | 0.85 | 2,358,345 | 15.20 |
| 1992 | -4.29 | 238,333 | 16.31 | -9.58 | 8,528 | 5.81 | -5.59 | 77,353 | 1.68 | -21.42 | 1,826,976 | 12.66 |
| 1993 | 45.85 | 326,772 | 19.53 | 61.34 | 12,228 | 30.91 | 49.20 | 102,478 | 56.52 | 13.59 | 2,270,842 | 17.13 |
| 1994 | -7.93 | 339,363 | -6.14 | 5.35 | 14,756 | -10.87 | 7.41 | 133,167 | -13.11 | 7.08 | 2,747,311 | -3.49 |
| 1995 | 7.58 | 400,968 | 21.97 | 25.29 | 19,237 | 20.36 | -1.19 | 139,736 | 17.69 | 0.35 | 2,846,585 | 15.48 |
| 1996 | 27.95 | 495,237 | 6.98 | 25.93 | 25,440 | 13.60 | 10.98 | 170,052 | 49.12 | -6.98 | 2,386,941 | 3.75 |
| 1997 | 40.01 | 606,704 | 4.78 | 45.30 | 33,347 | 16.69 | 64.80 | 252,960 | 25.69 | -16.06 | 1,812,145 | 3.85 |
| Netherland | New Zealand | South Africa | Switzerland | |||||||||
| Date | Stock Return | Market Capitalization | Bond Return | Stock Return | Market Capitalization | Bond Return | Stock Return | Market Capitalization | Bond Return | Stock Return | Market Capitalization | Bond Return |
| 1981 | 1.31 | 19,952 | 5.76 | 10.05 | 4,118 | 14.58 | -0.32 | 29,105 | 3.99 | -9.94 | 23,243 | -0.14 |
| 1982 | 24.85 | 21,604 | 29.26 | -19.02 | 2,931 | 11.43 | 50.82 | 36,353 | 28.94 | 12.70 | 22,587 | 13.72 |
| 1983 | 56.95 | 28,191 | 7.93 | 95.93 | 5,066 | 27.01 | 16.23 | 43,604 | -2.18 | 26.15 | 25,662 | 3.07 |
| 1984 | 28.91 | 29,677 | 15.85 | -0.57 | 3,508 | -20.39 | 11.53 | 27,711 | 2.08 | 1.56 | 21,677 | 1.99 |
| 1985 | 32.58 | 48,023 | 15.20 | 46.88 | 5,083 | 18.10 | 38.72 | 20,221 | 7.90 | 58.91 | 41,534 | 6.25 |
| 1986 | 8.10 | 65,100 | 11.77 | 104.09 | 9,702 | 22.95 | 59.67 | 27,349 | 35.09 | 10.95 | 64,444 | 7.43 |
| 1987 | -18.70 | 66,162 | 4.26 | -35.61 | 7,396 | 20.88 | -3.90 | 39,421 | 15.35 | -34.49 | 57,494 | 6.48 |
| 1988 | 31.20 | 75,787 | 5.22 | -2.64 | 9,120 | 20.43 | 7.97 | 33,229 | 8.18 | 11.60 | 66,135 | 1.07 |
| 1989 | 26.89 | 106,486 | -2.03 | 20.65 | 10,139 | 21.78 | 62.56 | 56,242 | 23.88 | 27.19 | 85,831 | -3.84 |
| 1990 | -13.25 | 101,225 | -0.97 | -34.78 | 6,516 | 12.28 | -7.12 | 53,254 | 18.85 | -20.82 | 90,166 | -0.20 |
| 1991 | 17.23 | 112,860 | 11.32 | 26.42 | 11,550 | 40.53 | 30.49 | 96,672 | 12.77 | 20.91 | 116,529 | 8.14 |
| 1992 | 9.00 | 110,892 | 19.02 | 0.19 | 10,591 | 15.66 | -7.05 | 58,864 | 26.63 | 24.60 | 145,659 | 14.02 |
| 1993 | 46.31 | 159,107 | 16.98 | 55.63 | 17,072 | 20.88 | 66.13 | 104,746 | 31.24 | 48.05 | 212,466 | 15.70 |
| 1994 | 1.95 | 181,095 | -6.18 | -3.75 | 18,908 | -12.72 | 23.27 | 130,245 | -11.15 | -7.29 | 224,792 | -4.28 |
| 1995 | 20.89 | 231,344 | 17.20 | 15.64 | 22,404 | 19.53 | 4.69 | 139,970 | 30.70 | 28.05 | 329,869 | 18.50 |
| 1996 | 35.34 | 290,811 | 9.09 | 11.19 | 24,446 | 11.12 | 8.15 | 117,848 | 4.88 | 19.37 | 339,927 | 5.03 |
| 1997 | 46.43 | 363,562 | 11.21 | 6.89 | 19,631 | 6.79 | -11.09 | 95,414 | 27.88 | 53.42 | 482,030 | 8.94 |
| UK | US | |||||
| Date | Stock Return | Market Capitalization | Bond Return | Stock Return | Market Capitalization | Bond Return |
| 1981 | 12.83 | 184,752 | 2.08 | -3.61 | 893,430 | 1.90 |
| 1982 | 28.52 | 191,266 | 51.53 | 22.44 | 1,049,433 | 39.16 |
| 1983 | 25.97 | 210,607 | 20.31 | 22.55 | 1,222,131 | -0.58 |
| 1984 | 30.18 | 211,340 | 9.96 | 6.24 | 1,228,621 | 14.22 |
| 1985 | 22.84 | 302,349 | 11.14 | 32.23 | 1,554,711 | 29.74 |
| 1986 | 26.29 | 403,071 | 9.16 | 17.68 | 1,743,364 | 25.21 |
| 1987 | 7.90 | 562,787 | 21.88 | 4.74 | 1,800,268 | -3.45 |
| 1988 | 10.08 | 567,570 | 9.54 | 17.84 | 1,956,196 | 9.94 |
| 1989 | 37.39 | 665,860 | 5.96 | 32.40 | 2,355,377 | 17.98 |
| 1990 | -8.26 | 705,011 | 8.07 | -3.49 | 2,186,563 | 6.85 |
| 1991 | 20.87 | 800,896 | 18.82 | 29.16 | 2,900,656 | 18.17 |
| 1992 | 19.55 | 757,364 | 14.30 | 5.90 | 3,074,287 | 8.07 |
| 1993 | 24.59 | 917,948 | 40.52 | 10.29 | 3,332,434 | 16.94 |
| 1994 | -6.95 | 903,719 | -9.98 | 1.56 | 3,296,047 | -6.19 |
| 1995 | 26.36 | 1,097,924 | 18.07 | 36.99 | 4,935,800 | 31.54 |
| 1996 | 15.79 | 1,392,185 | 9.42 | 21.29 | 5,926,178 | -1.44 |
| 1997 | 24.75 | #REF! | 22.98 | 34.41 | 8,003,025 | 14.51 |
1
The common stocks have seen a substantial rise in their value from 1926 to 1997. A dollar invested in 1926 in stocks in now worth $1828. The market capitalisation of our portfolio of selected 30 stocks has grown from $582 billion to $1833 billion. But there is no single stock which can be attributed to this gain. Over different periods different stocks have seen a surge in returns while some have tanked at the same period. Thus, there is a need of diversification in the investments of the investors to achieve high gains and yet remain on the lower side of the risk. And that itself is the theme of the portfolio and our suggestion for the investment policy of the new pension fund.
The analysis should begin by commending the decision to keep a portion of the investment in bonds intact. The ratio is not being commented here but just the decision of keeping bonds. Bonds move opposite to the stock markets. They are safe heavens for continuous and reasonable return demanding investors. They act as a cushion for the losses that the stock market is susceptible to. Specially the systematic risk which affects the whole stock market.
Moving on to the choice of the stocks themselves, it is suggested that the investment should be made in a diversified portfolio with stocks picked up from different industries. A higher return from the stocks generally means that the risk associate with the selected stocks will also be high. But if the stocks belong to a varied set of industries which are not dependent on each other then there is less chance of all the stocks to crash together. Thus, just the like the bonds, the stocks as well will nullify the losses in each stock and keep the returns to a positive level mostly.
Further the portfolios should be made using the value weighted method instead of the equally weighted method. This helps to assign larger capital to larger stocks. The portfolio is also balanced for the changes in the market capitalisation of different stocks. Due to this method is a stock starts losing its value, its weight in the portfolio is also decreased thereby, cutting losses. The smaller stocks affect the value of the portfolio lesser than the larger stocks. The overall risk of the portfolio is lesser than any individual stock and the returns remain reasonable high and much higher than the bonds or treasury bills that the current capital is completely invested in.
2
a)
| Treasury Bills | Treasury Bonds | Corporate Bonds | Common Stocks | |
| Average Annual Return | 4.03 | 5.57 | 5.82 | 12.96 |
| Minimum Return | -0.02 | -9.18 | -18.50 | -43.34 |
| Maximum Return | 16.00 | 40.36 | 42.56 | 53.99 |
| Standard Deviation | 3.51 | 9.21 | 9.09 | 20.32 |
The results for all the asset classes have been listed above.
b)
The invested $1 will change (increase or decrease) by the return of 1926. In 1927 the changed amount will be affected by return. The final amount after any year, given the amount in the beginning of the year is calculated by the following formula:
Final Amount = Initial amount(1 + return for the given year)
Following are the final amounts for each asset at the end of 1997:
| Treasury Bills | Treasury Bonds | Corporate Bonds | Common Stocks | |
| Final Amount | $16.50 | $38.52 | $45.78 | $1828.46 |
c)
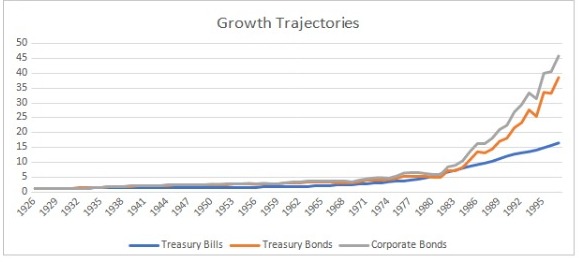
Growth trajectory for common stock has been displayed separately for ease of viewing.
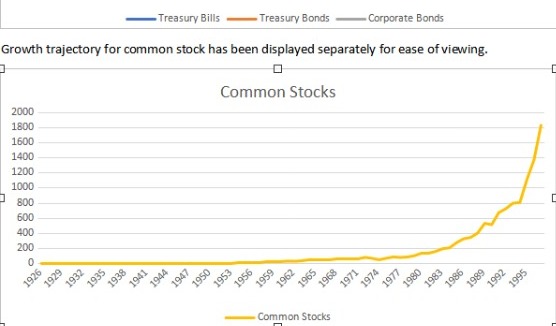
The common stocks have a much better average and maximum return than any other class. At the same time the minimum gain is also staggering for common stock with a fairly high standard deviation. It tells us that as the returns for an asset are high, then it also has a higher risk than other asset classes.
3
a)
| Average Monthly Return | Standard Deviation | |
| ALUMINUM COMPANY AMER |
0.97 |
6.72 |
| ALLIED SIGNAL INC |
2.02 |
6.45 |
| AMERICAN EXPRESS CO |
1.83 |
7.75 |
| AT&T |
1.02 |
6.37 |
| BETHLEHEM STEEL CORP |
0.24 |
10.77 |
| BOEING CO |
1.17 |
6.62 |
| CHEVRON CORP |
1.33 |
4.57 |
| COCA COLA CO |
2.45 |
5.85 |
| DU PONT |
1.73 |
6.15 |
| EASTMAN KODAK CO |
1.26 |
6.21 |
| EXXON CORP |
1.45 |
3.70 |
| GENERAL ELECTRIC CO |
2.08 |
5.63 |
| GENERAL MOTORS CORP |
1.08 |
7.66 |
| GOODYEAR TIRE & RUBR CO |
1.62 |
8.38 |
| INT BUSINESS MACHS CORP |
1.43 |
8.16 |
| INTERNATIONAL PAPER CO |
0.84 |
6.60 |
| NAVISTAR INT CORP |
0.51 |
12.96 |
| MCDONALDS CORP |
1.63 |
6.31 |
| MERCK & CO INC |
2.05 |
6.69 |
| 3M |
1.13 |
4.98 |
| PROCTER & GAMBLE CO |
1.96 |
5.83 |
| PHILIP MORRIS COS INC |
1.64 |
7.35 |
| PRIMERICA CORP |
3.05 |
9.06 |
| SEARS ROEBUCK & CO |
2.01 |
7.85 |
| TEXACO INC. |
1.18 |
4.46 |
| UNION CARBIDE |
2.27 |
8.36 |
| UNITED TECHNOLOGIES |
1.62 |
5.84 |
| WESTINGHOUSE |
0.45 |
8.74 |
| WOOLWORTH CORP |
0.20 |
9.93 |
| USX CORP |
0.65 |
6.98 |
b)
If we ignore the four stocks which have the highest standard deviations, then the average monthly seems to be higher when there is a higher standard deviation. The relationship is not very profound but there is a general increase in returns with an increased risk. For the four stocks with very high deviations they seem to from companies struggling at the current state.
4
In case of equal weighted portfolios, we assume that the portfolios are balanced to be equal each month.
a)
The return of equal weighted portfolio will be the average of the stocks it contains. The return of the value weighted portfolio will be the weighted average of the component stocks based on their market capitalisation.
The returns for equal weighted portfolios are as follows:
| EX + GM | GM + GE | GE + EX | |
|
31-Jan-90 |
-3.75 |
-2.5 |
-4.75 |
|
28-Feb-90 |
5.45 |
4.8 |
0.65 |
|
30-Mar-90 |
0.15 |
3.1 |
1.05 |
|
30-Apr-90 |
-2.7 |
-1.95 |
-1.15 |
|
31-May-90 |
9.5 |
10 |
7.9 |
|
29-Jun-90 |
-1.2 |
-0.8 |
0.1 |
|
31-Jul-90 |
3.15 |
0.65 |
5.9 |
|
31-Aug-90 |
-7.8 |
-13.25 |
-7.95 |
|
28-Sep-90 |
-5.4 |
-10.05 |
-6.65 |
|
31-Oct-90 |
0.7 |
-1.6 |
-2.3 |
|
30-Nov-90 |
3.05 |
3.35 |
5 |
|
31-Dec-90 |
-1.8 |
-0.05 |
3.95 |
|
31-Jan-91 |
2.65 |
8.5 |
5.65 |
|
28-Feb-91 |
9.1 |
8.55 |
7.55 |
|
28-Mar-91 |
0.85 |
-1 |
4.25 |
|
30-Apr-91 |
-1.8 |
-1.85 |
1.65 |
|
31-May-91 |
10.35 |
15.8 |
4.45 |
|
28-Jun-91 |
-2.85 |
-4.85 |
-2.2 |
|
31-Jul-91 |
-0.15 |
-1.75 |
0.6 |
|
30-Aug-91 |
-2.1 |
-0.6 |
0.7 |
|
30-Sep-91 |
0.25 |
-4.15 |
-2.3 |
|
31-Oct-91 |
-1.75 |
-3.25 |
1 |
|
29-Nov-91 |
-7.05 |
-8.75 |
-4.5 |
|
31-Dec-91 |
-1.15 |
6.45 |
11.4 |
|
31-Jan-92 |
3.9 |
5.25 |
-2.95 |
|
28-Feb-92 |
8.15 |
10.8 |
1.85 |
|
31-Mar-92 |
-3.25 |
-2.65 |
-3.6 |
|
30-Apr-92 |
11.45 |
7.25 |
5.4 |
|
29-May-92 |
-0.85 |
-2.1 |
0.95 |
|
30-Jun-92 |
6.7 |
6.9 |
2.3 |
|
31-Jul-92 |
-1.4 |
-3.5 |
0.5 |
|
31-Aug-92 |
-6.8 |
-9.6 |
-0.5 |
|
30-Sep-92 |
-3.9 |
-0.35 |
2.95 |
|
30-Oct-92 |
-4.2 |
-3.1 |
-3 |
|
30-Nov-92 |
1.9 |
7 |
3.4 |
|
31-Dec-92 |
1.35 |
1.75 |
3.1 |
|
29-Jan-93 |
8.55 |
8.9 |
0.35 |
|
26-Feb-93 |
2.25 |
-1.55 |
1.5 |
|
31-Mar-93 |
2.45 |
3.85 |
5.3 |
|
30-Apr-93 |
4.2 |
5.15 |
0.75 |
|
28-May-93 |
-0.5 |
0.5 |
1.3 |
|
30-Jun-93 |
5.95 |
7.4 |
2.45 |
|
30-Jul-93 |
4.1 |
5.95 |
1.05 |
|
31-Aug-93 |
-1.1 |
-1.6 |
0.2 |
|
30-Sep-93 |
-5.35 |
-6.35 |
-0.8 |
|
29-Oct-93 |
6.95 |
7.65 |
0.5 |
|
30-Nov-93 |
4.15 |
6.3 |
-0.75 |
|
31-Dec-93 |
2.3 |
5.65 |
3.95 |
|
31-Jan-94 |
8.45 |
7.15 |
4 |
|
28-Feb-94 |
-3 |
-3.4 |
-1.8 |
|
31-Mar-94 |
-5.3 |
-5.95 |
-3.75 |
|
29-Apr-94 |
2.65 |
0.25 |
-2.4 |
|
31-May-94 |
-3.25 |
-0.2 |
1.45 |
|
30-Jun-94 |
-6.85 |
-6.05 |
-6.4 |
|
29-Jul-94 |
3.5 |
5.1 |
6.4 |
|
31-Aug-94 |
-0.3 |
-1.5 |
0 |
|
30-Sep-94 |
-5.05 |
-4.6 |
-2.95 |
|
31-Oct-94 |
-3.2 |
-7.05 |
5.45 |
|
30-Nov-94 |
-2.9 |
-4.45 |
-4.35 |
|
30-Dec-94 |
5.55 |
11.15 |
6.2 |
|
31-Jan-95 |
-2.4 |
-3.35 |
1.95 |
|
28-Feb-95 |
6.8 |
8.25 |
4.85 |
|
31-Mar-95 |
3.75 |
1.3 |
1.85 |
|
28-Apr-95 |
3.45 |
3.15 |
4 |
|
31-May-95 |
5.4 |
5.3 |
3.7 |
|
30-Jun-95 |
-1.7 |
-2.2 |
-1.6 |
|
31-Jul-95 |
3.35 |
4.35 |
3.7 |
|
31-Aug-95 |
-3.4 |
-1.45 |
-2.15 |
|
29-Sep-95 |
2.3 |
4.25 |
7.05 |
|
31-Oct-95 |
-0.5 |
-3.75 |
2.45 |
|
30-Nov-95 |
6.9 |
8.8 |
4.2 |
|
29-Dec-95 |
6.9 |
8.45 |
6.35 |
|
31-Jan-96 |
-0.8 |
3.05 |
2.75 |
|
29-Feb-96 |
-0.95 |
-1.75 |
-0.8 |
|
29-Mar-96 |
3.2 |
3.85 |
3.15 |
|
30-Apr-96 |
3.1 |
0.55 |
1.75 |
|
31-May-96 |
1.5 |
4.75 |
3.85 |
|
28-Jun-96 |
-1.25 |
-0.1 |
3.65 |
|
31-Jul-96 |
-6.1 |
-5.8 |
-5 |
|
30-Aug-96 |
1.3 |
1.85 |
0.55 |
|
30-Sep-96 |
-0.6 |
3.35 |
6.05 |
|
31-Oct-96 |
9.1 |
9 |
6.4 |
|
29-Nov-96 |
7.8 |
7.85 |
7.45 |
|
31-Dec-96 |
0.25 |
-3.85 |
-0.3 |
|
31-Jan-97 |
5.75 |
5.25 |
5.2 |
|
28-Feb-97 |
-1.8 |
-0.85 |
-1.55 |
|
31-Mar-97 |
1.6 |
-3.65 |
2.25 |
|
30-Apr-97 |
4.8 |
8.15 |
8.45 |
|
30-May-97 |
2.7 |
4.4 |
7.1 |
|
30-Jun-97 |
0.3 |
2.45 |
5.55 |
|
31-Jul-97 |
7.95 |
9.65 |
6.6 |
|
29-Aug-97 |
-0.95 |
-4.3 |
-7.45 |
|
30-Sep-97 |
5.7 |
7.95 |
6.95 |
|
31-Oct-97 |
-4.1 |
-4.6 |
-4.6 |
|
28-Nov-97 |
-2.15 |
5 |
7.15 |
|
31-Dec-97 |
3.05 |
2.75 |
0 |
|
30-Jan-98 |
-3.85 |
0.5 |
1.25 |
|
27-Feb-98 |
14 |
10.05 |
4.25 |
|
31-Mar-98 |
2.2 |
4.75 |
8.65 |
|
30-Apr-98 |
3.7 |
-0.9 |
3.4 |
|
29-May-98 |
2.25 |
2.65 |
-2.5 |
|
30-Jun-98 |
-2.9 |
1 |
5.1 |
The returns of value weighted portfolios are as follows:
| EX + GM | GM + GE | GE + EX | |
|
31-Jan-90 |
-4.70 |
-2.89 |
-4.80 |
|
28-Feb-90 |
3.78 |
2.96 |
0.67 |
|
30-Mar-90 |
-0.61 |
3.41 |
0.97 |
|
30-Apr-90 |
-2.42 |
-1.40 |
-1.15 |
|
31-May-90 |
8.74 |
9.41 |
7.90 |
|
29-Jun-90 |
-0.89 |
-0.33 |
0.11 |
|
31-Jul-90 |
5.00 |
1.66 |
5.85 |
|
31-Aug-90 |
-5.70 |
-13.31 |
-7.93 |
|
28-Sep-90 |
-3.88 |
-10.55 |
-6.38 |
|
31-Oct-90 |
0.37 |
-2.74 |
-2.03 |
|
30-Nov-90 |
3.82 |
4.04 |
4.96 |
|
31-Dec-90 |
0.13 |
2.12 |
3.72 |
|
31-Jan-91 |
1.18 |
9.76 |
4.93 |
|
28-Feb-91 |
8.61 |
7.87 |
7.59 |
|
28-Mar-91 |
3.41 |
0.47 |
4.38 |
|
30-Apr-91 |
0.03 |
-0.28 |
1.65 |
|
31-May-91 |
4.13 |
12.95 |
3.97 |
|
28-Jun-91 |
-1.60 |
-4.56 |
-2.13 |
|
31-Jul-91 |
0.99 |
-1.42 |
0.69 |
|
30-Aug-91 |
-1.44 |
0.65 |
0.59 |
|
30-Sep-91 |
1.20 |
-5.36 |
-2.07 |
|
31-Oct-91 |
0.48 |
-2.02 |
1.15 |
|
29-Nov-91 |
-4.68 |
-7.55 |
-4.30 |
|
31-Dec-91 |
1.76 |
12.69 |
10.43 |
|
31-Jan-92 |
-1.18 |
1.30 |
-3.04 |
|
28-Feb-92 |
3.07 |
7.45 |
1.71 |
|
31-Mar-92 |
-3.73 |
-2.82 |
-3.61 |
|
30-Apr-92 |
10.52 |
4.30 |
5.48 |
|
29-May-92 |
0.64 |
-1.30 |
1.02 |
|
30-Jun-92 |
4.36 |
4.89 |
2.29 |
|
31-Jul-92 |
0.34 |
-2.78 |
0.65 |
|
31-Aug-92 |
-2.54 |
-7.12 |
-0.24 |
|
30-Sep-92 |
-2.12 |
2.77 |
2.55 |
|
30-Oct-92 |
-4.14 |
-2.50 |
-3.09 |
|
30-Nov-92 |
-0.13 |
7.77 |
3.02 |
|
31-Dec-92 |
2.08 |
2.67 |
3.09 |
|
29-Jan-93 |
3.94 |
4.59 |
0.34 |
|
26-Feb-93 |
3.72 |
-1.90 |
1.56 |
|
31-Mar-93 |
3.18 |
5.17 |
5.23 |
|
30-Apr-93 |
1.95 |
3.48 |
0.71 |
|
28-May-93 |
-0.12 |
1.32 |
1.27 |
|
30-Jun-93 |
3.56 |
5.74 |
2.43 |
|
30-Jul-93 |
1.91 |
4.59 |
1.05 |
|
31-Aug-93 |
-0.37 |
-1.05 |
0.19 |
|
30-Sep-93 |
-3.02 |
-4.37 |
-0.82 |
|
29-Oct-93 |
3.61 |
4.62 |
0.50 |
|
30-Nov-93 |
1.24 |
4.23 |
-0.73 |
|
31-Dec-93 |
1.70 |
6.28 |
4.08 |
|
31-Jan-94 |
7.39 |
5.40 |
3.91 |
|
28-Feb-94 |
-2.50 |
-2.97 |
-1.82 |
|
31-Mar-94 |
-4.59 |
-5.38 |
-3.79 |
|
29-Apr-94 |
1.74 |
-1.67 |
-2.51 |
|
31-May-94 |
-2.74 |
1.34 |
1.51 |
|
30-Jun-94 |
-6.96 |
-5.88 |
-6.36 |
|
29-Jul-94 |
3.90 |
6.15 |
6.50 |
|
31-Aug-94 |
0.18 |
-1.38 |
-0.09 |
|
30-Sep-94 |
-4.51 |
-3.78 |
-2.92 |
|
31-Oct-94 |
1.05 |
-3.57 |
5.17 |
|
30-Nov-94 |
-2.86 |
-5.14 |
-4.40 |
|
30-Dec-94 |
3.34 |
11.45 |
6.33 |
|
31-Jan-95 |
-0.24 |
-1.32 |
1.88 |
|
28-Feb-95 |
5.26 |
7.27 |
4.94 |
|
31-Mar-95 |
3.98 |
0.37 |
1.65 |
|
28-Apr-95 |
3.81 |
3.41 |
3.98 |
|
31-May-95 |
4.71 |
4.49 |
3.69 |
|
30-Jun-95 |
-1.45 |
-2.15 |
-1.63 |
|
31-Jul-95 |
3.07 |
4.51 |
3.74 |
|
31-Aug-95 |
-3.70 |
-0.87 |
-2.05 |
|
29-Sep-95 |
3.46 |
6.52 |
7.20 |
|
31-Oct-95 |
2.22 |
-2.25 |
2.16 |
|
30-Nov-95 |
4.66 |
7.37 |
4.31 |
|
29-Dec-95 |
5.95 |
8.17 |
6.47 |
|
31-Jan-96 |
-0.93 |
4.84 |
3.09 |
|
29-Feb-96 |
-0.54 |
-1.67 |
-0.90 |
|
29-Mar-96 |
2.89 |
3.82 |
3.23 |
|
30-Apr-96 |
3.62 |
-0.17 |
1.43 |
|
31-May-96 |
1.10 |
5.96 |
4.17 |
|
28-Jun-96 |
0.37 |
2.52 |
3.80 |
|
31-Jul-96 |
-5.73 |
-5.17 |
-4.96 |
|
30-Aug-96 |
0.69 |
1.42 |
0.63 |
|
30-Sep-96 |
0.64 |
7.16 |
6.66 |
|
31-Oct-96 |
7.85 |
7.35 |
6.38 |
|
29-Nov-96 |
7.62 |
7.64 |
7.46 |
|
31-Dec-96 |
1.88 |
-4.18 |
-1.07 |
|
31-Jan-97 |
5.73 |
4.93 |
5.13 |
|
28-Feb-97 |
-2.14 |
-0.70 |
-1.42 |
|
31-Mar-97 |
4.43 |
-3.27 |
1.45 |
|
30-Apr-97 |
4.96 |
10.33 |
8.78 |
|
30-May-97 |
4.14 |
7.23 |
7.39 |
|
30-Jun-97 |
2.01 |
5.83 |
5.86 |
|
31-Jul-97 |
6.19 |
8.73 |
6.88 |
|
29-Aug-97 |
-2.71 |
-8.66 |
-8.05 |
|
30-Sep-97 |
5.16 |
8.75 |
7.28 |
|
31-Oct-97 |
-4.10 |
-4.92 |
-4.68 |
|
28-Nov-97 |
-1.00 |
10.96 |
8.32 |
|
31-Dec-97 |
1.54 |
0.64 |
-0.07 |
|
30-Jan-98 |
-3.43 |
4.05 |
2.24 |
|
27-Feb-98 |
10.74 |
3.01 |
3.19 |
|
31-Mar-98 |
4.25 |
9.13 |
9.25 |
|
30-Apr-98 |
6.13 |
-1.12 |
2.21 |
|
29-May-98 |
-0.80 |
-0.76 |
-2.41 |
|
30-Jun-98 |
-0.59 |
6.60 |
5.97 |
b)
The following are the average monthly returns and the standard deviations.
|
Equal Weighted |
Value Weighted |
||||||
| EX + GM | GM + GE | GE + EX | EX + GM | GM + GE | GE + EX | ||
| Mean |
1.261275 |
1.576961 |
1.761765 |
1.287443 |
1.796778 |
1.760577 |
|
| Stndard Deviations |
4.573773 |
5.464012 |
3.948243 |
3.70273 |
5.298629 |
3.983252 |
|
c)
| EXXON CORP | GENERAL ELECTRIC CO | GENERAL MOTORS CORP | |
|
Mean |
1.446078 |
2.077451 |
1.076471 |
|
Stndard Deviations |
3.70399 |
5.625436 |
7.659333 |
We see that the standard deviations are comparatively lower than their individual stock components and yet at the same time the returns have not been impacted as much. The effect is more profound in case of the value weighted portfolios.
This seems to have been due to the diversification which the addition of different stocks has brought about.
5
a)
The following are the calculated portfolio returns:
| 5 Stocks | 10 Stocks | 30 Stocks | |
|
31-Jan-90 |
-13.49 |
-9.16 |
-5.44 |
|
28-Feb-90 |
1.50 |
2.58 |
2.02 |
|
30-Mar-90 |
2.76 |
3.13 |
2.59 |
|
30-Apr-90 |
-3.06 |
-2.39 |
-0.77 |
|
31-May-90 |
7.32 |
10.47 |
9.01 |
|
29-Jun-90 |
-5.91 |
-2.17 |
0.23 |
|
31-Jul-90 |
-3.59 |
1.52 |
1.36 |
|
31-Aug-90 |
-12.46 |
-9.36 |
-8.86 |
|
28-Sep-90 |
-5.54 |
-5.90 |
-4.78 |
|
31-Oct-90 |
2.32 |
2.40 |
0.83 |
|
30-Nov-90 |
-1.23 |
3.14 |
5.08 |
|
31-Dec-90 |
-2.41 |
-0.07 |
2.08 |
|
31-Jan-91 |
8.86 |
4.32 |
4.54 |
|
28-Feb-91 |
2.90 |
4.20 |
6.78 |
|
28-Mar-91 |
5.85 |
2.62 |
1.49 |
|
30-Apr-91 |
3.29 |
1.87 |
-0.32 |
|
31-May-91 |
0.90 |
4.34 |
5.05 |
|
28-Jun-91 |
0.58 |
-3.00 |
-4.25 |
|
31-Jul-91 |
6.80 |
6.34 |
4.18 |
|
30-Aug-91 |
-0.82 |
2.72 |
1.85 |
|
30-Sep-91 |
-3.55 |
-2.19 |
-0.68 |
|
31-Oct-91 |
-1.00 |
1.52 |
0.16 |
|
29-Nov-91 |
-5.96 |
-3.72 |
-3.69 |
|
31-Dec-91 |
9.25 |
8.90 |
9.40 |
|
31-Jan-92 |
-2.15 |
-1.66 |
-0.80 |
|
28-Feb-92 |
0.78 |
-0.10 |
0.81 |
|
31-Mar-92 |
8.85 |
3.01 |
-0.95 |
|
30-Apr-92 |
6.07 |
5.46 |
4.81 |
|
29-May-92 |
-1.03 |
1.26 |
0.96 |
|
30-Jun-92 |
0.99 |
-3.78 |
-1.32 |
|
31-Jul-92 |
1.19 |
3.74 |
2.95 |
|
31-Aug-92 |
-5.28 |
-2.17 |
-2.69 |
|
30-Sep-92 |
3.63 |
-0.72 |
-0.12 |
|
30-Oct-92 |
0.76 |
-0.38 |
-3.21 |
|
30-Nov-92 |
7.15 |
2.25 |
2.99 |
|
31-Dec-92 |
8.07 |
4.84 |
0.31 |
|
29-Jan-93 |
2.03 |
1.79 |
0.30 |
|
26-Feb-93 |
5.44 |
3.77 |
1.53 |
|
31-Mar-93 |
2.61 |
2.86 |
1.75 |
|
30-Apr-93 |
-0.57 |
-0.78 |
-2.12 |
|
28-May-93 |
7.91 |
5.81 |
3.81 |
|
30-Jun-93 |
3.81 |
0.41 |
0.49 |
|
30-Jul-93 |
0.86 |
1.29 |
0.09 |
|
31-Aug-93 |
0.20 |
2.44 |
2.24 |
|
30-Sep-93 |
-3.51 |
-2.32 |
-2.62 |
|
29-Oct-93 |
-2.94 |
-0.20 |
3.31 |
|
30-Nov-93 |
-3.72 |
-3.15 |
0.62 |
|
31-Dec-93 |
-1.19 |
1.03 |
1.69 |
|
31-Jan-94 |
7.45 |
3.85 |
4.78 |
|
28-Feb-94 |
-7.23 |
-3.17 |
-4.15 |
|
31-Mar-94 |
-2.83 |
-2.60 |
-4.49 |
|
29-Apr-94 |
0.18 |
2.15 |
1.82 |
|
31-May-94 |
5.66 |
3.77 |
1.85 |
|
30-Jun-94 |
-0.79 |
-1.26 |
-3.29 |
|
29-Jul-94 |
2.60 |
3.70 |
3.96 |
|
31-Aug-94 |
1.14 |
1.66 |
3.78 |
|
30-Sep-94 |
-0.31 |
0.38 |
-0.86 |
|
31-Oct-94 |
1.67 |
2.33 |
2.44 |
|
30-Nov-94 |
-8.96 |
-4.92 |
-3.78 |
|
30-Dec-94 |
2.91 |
2.70 |
2.99 |
|
31-Jan-95 |
0.00 |
-0.40 |
1.16 |
|
28-Feb-95 |
3.91 |
4.92 |
4.88 |
|
31-Mar-95 |
1.90 |
3.74 |
3.49 |
|
28-Apr-95 |
-0.84 |
2.12 |
3.66 |
|
31-May-95 |
0.89 |
3.65 |
4.03 |
|
30-Jun-95 |
4.99 |
2.92 |
1.57 |
|
31-Jul-95 |
2.51 |
2.22 |
2.71 |
|
31-Aug-95 |
4.97 |
0.91 |
-0.78 |
|
29-Sep-95 |
12.00 |
8.14 |
6.91 |
|
31-Oct-95 |
-3.63 |
-1.83 |
0.09 |
|
30-Nov-95 |
4.70 |
6.17 |
6.38 |
|
29-Dec-95 |
-1.83 |
0.18 |
2.22 |
|
31-Jan-96 |
4.80 |
3.80 |
4.57 |
|
29-Feb-96 |
-2.27 |
1.85 |
1.15 |
|
29-Mar-96 |
0.12 |
2.27 |
0.42 |
|
30-Apr-96 |
-0.27 |
-0.49 |
0.01 |
|
31-May-96 |
-0.41 |
3.75 |
3.73 |
|
28-Jun-96 |
-0.56 |
1.97 |
1.49 |
|
31-Jul-96 |
-10.44 |
-5.16 |
-3.36 |
|
30-Aug-96 |
1.56 |
3.30 |
1.31 |
|
30-Sep-96 |
1.46 |
3.27 |
4.81 |
|
31-Oct-96 |
-5.16 |
-0.64 |
3.00 |
|
29-Nov-96 |
11.58 |
4.85 |
8.12 |
|
31-Dec-96 |
6.30 |
2.99 |
0.32 |
|
31-Jan-97 |
0.92 |
6.28 |
6.23 |
|
28-Feb-97 |
2.77 |
1.99 |
1.47 |
|
31-Mar-97 |
-8.62 |
-6.00 |
-4.31 |
|
30-Apr-97 |
1.14 |
5.35 |
6.84 |
|
30-May-97 |
7.77 |
6.09 |
6.05 |
|
30-Jun-97 |
1.99 |
2.86 |
4.61 |
|
31-Jul-97 |
9.23 |
4.93 |
6.39 |
|
29-Aug-97 |
-2.07 |
-8.16 |
-7.49 |
|
30-Sep-97 |
8.25 |
4.95 |
5.08 |
|
31-Oct-97 |
0.36 |
-4.76 |
-5.46 |
|
28-Nov-97 |
7.69 |
7.38 |
7.69 |
|
31-Dec-97 |
9.67 |
3.74 |
2.06 |
|
30-Jan-98 |
0.43 |
-1.74 |
-0.45 |
|
27-Feb-98 |
1.16 |
5.54 |
6.33 |
|
31-Mar-98 |
4.61 |
6.46 |
5.14 |
|
30-Apr-98 |
-0.83 |
0.34 |
0.44 |
|
29-May-98 |
-0.47 |
1.20 |
-0.23 |
|
30-Jun-98 |
0.04 |
2.58 |
3.69 |
b)
| 5 Stocks | 10 Stocks | 30 Stocks | |
| Mean |
1.13 |
1.46 |
1.51 |
| Standard Deviation |
4.93 |
3.73 |
3.58 |
c)
We see that as the number of stocks in a portfolio increases the standard deviation decreases. This arises because the added stocks in the portfolio decreases the saturation of a single portfolio or industry. We have stocks of multiple industries. When one stock declines some other industry/stock gains. Thus, the losses are cushioned by the gains of other stocks. This combined decreases the risk in a well-diversified portfolio.
Looking for best Finance Assignment Help. Whatsapp us at +16469488918 or chat with our chat representative showing on lower right corner or order from here. You can also take help from our Live Assignment helper for any exam or live assignment related assistance.